BTM Institutional Supply & Demand Zones [Scored]
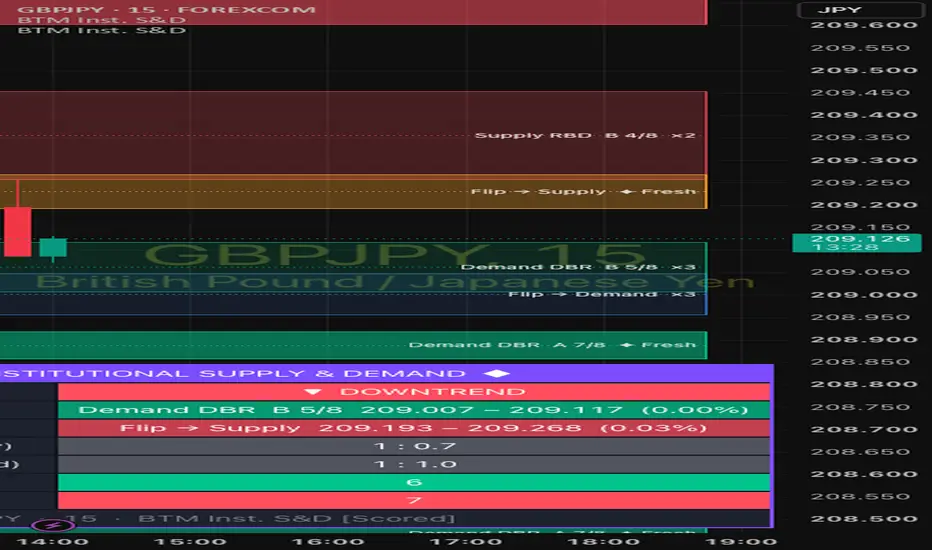
BTM Institutional Supply & Demand Zones [Scored] automatically detects supply and demand zones using the classic Leg-In → Base → Leg-Out method, grades every zone with a transparent 8-point scoring system, and tracks each zone through its full life: fresh, retested, broken and flipped.
WHY THIS INDICATOR IS DIFFERENT
Many supply and demand tools draw a box at every pause in price, which fills the chart with weak zones. This script only draws a zone when a short, indecisive base is followed by a strong candle that closes clean beyond it. Every zone is then scored using the well-known "odds enhancers" from the supply and demand method, so you can see at a glance which zones are worth watching and which are not.
HOW ZONES ARE DETECTED
1. Base: 1 to 6 indecisive candles (body no more than 50% of the candle's range by default).
2. Leg-out: a strong candle (body at least 60% of its range and a range of at least 1× ATR by default) that closes beyond the base.
3. Leg-in: the candle before the base sets the pattern type:
- DBR (Drop-Base-Rally) – demand, reversal
- RBR (Rally-Base-Rally) – demand, continuation
- RBD (Rally-Base-Drop) – supply, reversal
- DBD (Drop-Base-Drop) – supply, continuation
The entry edge (proximal line) is drawn at the base candle bodies by default, and the stop edge (distal line) at the base wicks. Both can be adjusted.
THE SCORING SYSTEM (OUT OF 8)
- Departure strength (0–2): how forcefully price left the zone
- Time at level (0–2): fewer base candles score higher
- Freshness (0–2): untouched zones score highest; each retest lowers the score
- Pattern (0–1): reversal patterns (DBR / RBD) earn an extra point
- Location (0–1): demand in the lower half or supply in the upper half of the recent range earns an extra point
Grades: A = 6–8, B = 4–5, C = 0–3. Each zone label shows the pattern, grade and score, for example "Demand DBR A 7/8 ✦ Fresh".
ZONE LIFECYCLE
- Fresh zones are drawn brighter.
- Each retest fades the zone and lowers its score. Zones are removed after 3 retests by default.
- A close through the far edge breaks the zone. Broken zones can flip: a broken demand zone becomes supply, and a broken supply zone becomes demand.
COLOUR KEY
- Green – Demand zone
- Red – Supply zone
- Blue – Broken supply flipped to demand
- Orange – Broken demand flipped to supply
- Dotted line – 50% level of the zone
REACTION SIGNALS
A BUY label appears when price taps a qualifying demand zone and a candle closes back above it in the zone's direction. A SELL label appears for the opposite at supply. You can set the minimum zone grade required for signals and how many bars price has to react.
DASHBOARD
A colour-coded table shows:
- Trend direction based on an EMA
- Nearest demand and supply zones with price range and distance
- Estimated risk:reward from one zone to the opposite zone (highlighted at 1:2 or better)
- Number of active demand and supply zones
Position, size, theme and accent colour are fully adjustable.
HOW TO USE IT
1. Check the trend on the dashboard. Favour demand zones in an uptrend and supply zones in a downtrend, or turn on the trend filter.
2. Focus on A-grade, fresh zones.
3. Wait for price to return to the zone and react. A BUY or SELL signal confirms a reaction, but always check the chart yourself.
4. Place your stop beyond the far edge of the zone.
5. Use the nearest opposite zone as a target and check the R:R on the dashboard.
SUGGESTED SETTINGS
- Beginners: Minimum grade A, trend filter on, signals on.
- Experienced traders: Minimum grade B, wick entry edge, leg-in included for wider protective stops.
- Higher timeframes give fewer, stronger zones. Lower timeframes give more zones and more noise.
NON-REPAINTING
By default the script only acts on closed candles, so zones and signals do not appear and disappear on the live candle. Once drawn, a zone's position does not change.
ALERTS
Alerts are available for new demand and supply zones, zone retests, BUY and SELL reactions, flipped zones, and a combined "any event" alert.
DISCLAIMER
This indicator identifies price zones based on supply and demand concepts. It does not predict future price movement and is not financial advice. Zones and signals can and do fail. Always test it on historical data, use proper risk management, and make your own trading decisions.
WHY THIS INDICATOR IS DIFFERENT
Many supply and demand tools draw a box at every pause in price, which fills the chart with weak zones. This script only draws a zone when a short, indecisive base is followed by a strong candle that closes clean beyond it. Every zone is then scored using the well-known "odds enhancers" from the supply and demand method, so you can see at a glance which zones are worth watching and which are not.
HOW ZONES ARE DETECTED
1. Base: 1 to 6 indecisive candles (body no more than 50% of the candle's range by default).
2. Leg-out: a strong candle (body at least 60% of its range and a range of at least 1× ATR by default) that closes beyond the base.
3. Leg-in: the candle before the base sets the pattern type:
- DBR (Drop-Base-Rally) – demand, reversal
- RBR (Rally-Base-Rally) – demand, continuation
- RBD (Rally-Base-Drop) – supply, reversal
- DBD (Drop-Base-Drop) – supply, continuation
The entry edge (proximal line) is drawn at the base candle bodies by default, and the stop edge (distal line) at the base wicks. Both can be adjusted.
THE SCORING SYSTEM (OUT OF 8)
- Departure strength (0–2): how forcefully price left the zone
- Time at level (0–2): fewer base candles score higher
- Freshness (0–2): untouched zones score highest; each retest lowers the score
- Pattern (0–1): reversal patterns (DBR / RBD) earn an extra point
- Location (0–1): demand in the lower half or supply in the upper half of the recent range earns an extra point
Grades: A = 6–8, B = 4–5, C = 0–3. Each zone label shows the pattern, grade and score, for example "Demand DBR A 7/8 ✦ Fresh".
ZONE LIFECYCLE
- Fresh zones are drawn brighter.
- Each retest fades the zone and lowers its score. Zones are removed after 3 retests by default.
- A close through the far edge breaks the zone. Broken zones can flip: a broken demand zone becomes supply, and a broken supply zone becomes demand.
COLOUR KEY
- Green – Demand zone
- Red – Supply zone
- Blue – Broken supply flipped to demand
- Orange – Broken demand flipped to supply
- Dotted line – 50% level of the zone
REACTION SIGNALS
A BUY label appears when price taps a qualifying demand zone and a candle closes back above it in the zone's direction. A SELL label appears for the opposite at supply. You can set the minimum zone grade required for signals and how many bars price has to react.
DASHBOARD
A colour-coded table shows:
- Trend direction based on an EMA
- Nearest demand and supply zones with price range and distance
- Estimated risk:reward from one zone to the opposite zone (highlighted at 1:2 or better)
- Number of active demand and supply zones
Position, size, theme and accent colour are fully adjustable.
HOW TO USE IT
1. Check the trend on the dashboard. Favour demand zones in an uptrend and supply zones in a downtrend, or turn on the trend filter.
2. Focus on A-grade, fresh zones.
3. Wait for price to return to the zone and react. A BUY or SELL signal confirms a reaction, but always check the chart yourself.
4. Place your stop beyond the far edge of the zone.
5. Use the nearest opposite zone as a target and check the R:R on the dashboard.
SUGGESTED SETTINGS
- Beginners: Minimum grade A, trend filter on, signals on.
- Experienced traders: Minimum grade B, wick entry edge, leg-in included for wider protective stops.
- Higher timeframes give fewer, stronger zones. Lower timeframes give more zones and more noise.
NON-REPAINTING
By default the script only acts on closed candles, so zones and signals do not appear and disappear on the live candle. Once drawn, a zone's position does not change.
ALERTS
Alerts are available for new demand and supply zones, zone retests, BUY and SELL reactions, flipped zones, and a combined "any event" alert.
DISCLAIMER
This indicator identifies price zones based on supply and demand concepts. It does not predict future price movement and is not financial advice. Zones and signals can and do fail. Always test it on historical data, use proper risk management, and make your own trading decisions.

Haftungsausschluss
Die Informationen und Veröffentlichungen sind nicht als Finanz-, Anlage-, Handels- oder andere Arten von Ratschlägen oder Empfehlungen gedacht, die von TradingView bereitgestellt oder gebilligt werden, und stellen diese nicht dar. Lesen Sie mehr in den Nutzungsbedingungen.
Haftungsausschluss
Die Informationen und Veröffentlichungen sind nicht als Finanz-, Anlage-, Handels- oder andere Arten von Ratschlägen oder Empfehlungen gedacht, die von TradingView bereitgestellt oder gebilligt werden, und stellen diese nicht dar. Lesen Sie mehr in den Nutzungsbedingungen.