SSMT+
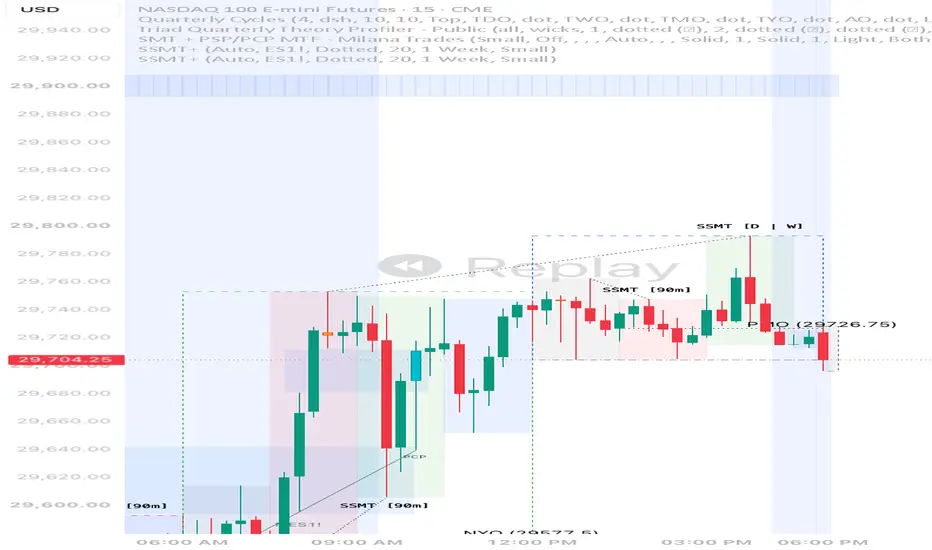
Quarterly Theory SSMT indicator
Identify and visualize Smart Money Technique (SSMT) divergences across five market cycles: Micro, 90-Minute, Daily Cycle (DC), Daily, and Monthly using ES (S&P 500 E-mini futures) as a confirmation instrument against the primary trading asset, such as NQ.
The indicator detects divergences between correlated assets when one instrument takes a significant high or low while the other fails to do so, signaling potential liquidity raids, relative strength or weakness, and possible market reversals.
Key Features
Micro SSMT: Identifies short-term divergences for precision entries and intraday confirmation.
90-Minute SSMT: Detects divergences within 90-minute cycles to identify potential manipulation and distribution opportunities.
DC SSMT: Tracks Daily Cycle divergences to highlight potential cycle reversals and intraday directional shifts.
Daily SSMT: Identifies divergences between daily highs and lows to reveal broader directional bias and potential draw-on-liquidity shifts.
Monthly SSMT: Detects divergences between monthly highs and lows to identify higher-timeframe liquidity raids and potential macro reversals.
ES Confirmation: Uses ES price action to validate or invalidate SSMT signals on the primary trading instrument.
Bullish and Bearish Signals: Distinguishes bullish SSMTs, where one asset makes a lower low while the other holds a higher low, from bearish SSMTs, where one asset makes a higher high while the other holds a lower high.
Multi-Cycle Visualization: Separates signals by cycle timeframe to help traders distinguish short-term entry opportunities from higher-timeframe directional confirmation.
Designed for traders using ICT, Smart Money Concepts (SMC), and Quarterly Theory, this indicator helps organize multi-timeframe intermarket divergence into a single charting tool. Use SSMT signals alongside liquidity levels, premium and discount arrays, displacement, and market structure shifts to build a more complete trading model.
Note: SSMT signals indicate potential divergence, not guaranteed reversals. ES confirmation should be evaluated alongside the relevant cycle boundaries and price action.
Identify and visualize Smart Money Technique (SSMT) divergences across five market cycles: Micro, 90-Minute, Daily Cycle (DC), Daily, and Monthly using ES (S&P 500 E-mini futures) as a confirmation instrument against the primary trading asset, such as NQ.
The indicator detects divergences between correlated assets when one instrument takes a significant high or low while the other fails to do so, signaling potential liquidity raids, relative strength or weakness, and possible market reversals.
Key Features
Micro SSMT: Identifies short-term divergences for precision entries and intraday confirmation.
90-Minute SSMT: Detects divergences within 90-minute cycles to identify potential manipulation and distribution opportunities.
DC SSMT: Tracks Daily Cycle divergences to highlight potential cycle reversals and intraday directional shifts.
Daily SSMT: Identifies divergences between daily highs and lows to reveal broader directional bias and potential draw-on-liquidity shifts.
Monthly SSMT: Detects divergences between monthly highs and lows to identify higher-timeframe liquidity raids and potential macro reversals.
ES Confirmation: Uses ES price action to validate or invalidate SSMT signals on the primary trading instrument.
Bullish and Bearish Signals: Distinguishes bullish SSMTs, where one asset makes a lower low while the other holds a higher low, from bearish SSMTs, where one asset makes a higher high while the other holds a lower high.
Multi-Cycle Visualization: Separates signals by cycle timeframe to help traders distinguish short-term entry opportunities from higher-timeframe directional confirmation.
Designed for traders using ICT, Smart Money Concepts (SMC), and Quarterly Theory, this indicator helps organize multi-timeframe intermarket divergence into a single charting tool. Use SSMT signals alongside liquidity levels, premium and discount arrays, displacement, and market structure shifts to build a more complete trading model.
Note: SSMT signals indicate potential divergence, not guaranteed reversals. ES confirmation should be evaluated alongside the relevant cycle boundaries and price action.

Haftungsausschluss
Die Informationen und Veröffentlichungen sind nicht als Finanz-, Anlage-, Handels- oder andere Arten von Ratschlägen oder Empfehlungen gedacht, die von TradingView bereitgestellt oder gebilligt werden, und stellen diese nicht dar. Lesen Sie mehr in den Nutzungsbedingungen.
Haftungsausschluss
Die Informationen und Veröffentlichungen sind nicht als Finanz-, Anlage-, Handels- oder andere Arten von Ratschlägen oder Empfehlungen gedacht, die von TradingView bereitgestellt oder gebilligt werden, und stellen diese nicht dar. Lesen Sie mehr in den Nutzungsbedingungen.