Quarterly Divider + IPDA Data Ranges 20D/40D /60D
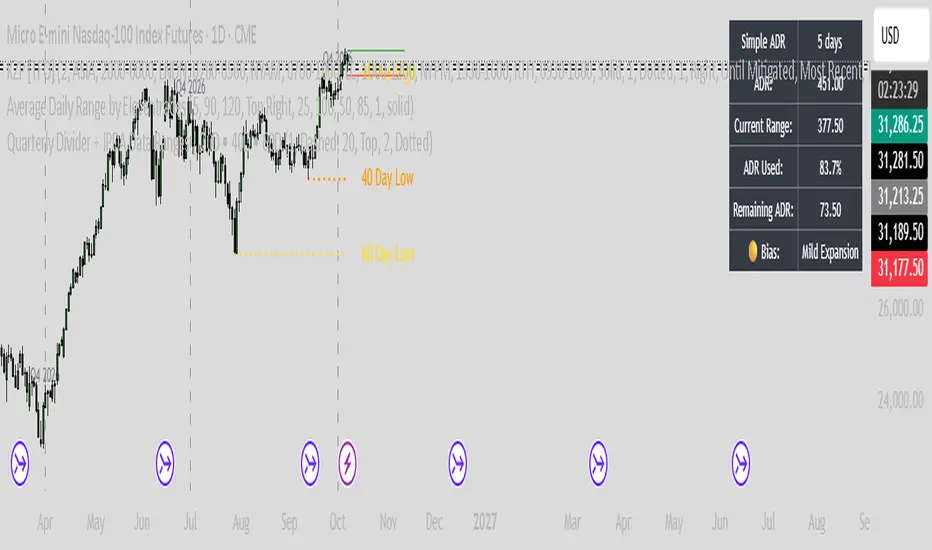
This indicator combines quarterly dividers with IPDA 20, 40 and 60 day data ranges. At the start of each new quarter, it identifies the highest confirmed swing high and lowest confirmed swing low from the previous 20, 40 and 60 trading days and projects those levels forward into the new quarter.
Each range is drawn from the actual swing candle where the high or low occurred, giving you clear reference levels for your quarterly analysis. The levels remain active until price reaches them, while the quarterly dividers help clearly separate each new market quarter.
The indicator also includes custom colour, thickness and line-style settings, allowing you to use solid, dashed or dotted lines for your IPDA levels and quarterly dividers.
Each range is drawn from the actual swing candle where the high or low occurred, giving you clear reference levels for your quarterly analysis. The levels remain active until price reaches them, while the quarterly dividers help clearly separate each new market quarter.
The indicator also includes custom colour, thickness and line-style settings, allowing you to use solid, dashed or dotted lines for your IPDA levels and quarterly dividers.

Haftungsausschluss
Die Informationen und Veröffentlichungen sind nicht als Finanz-, Anlage-, Handels- oder andere Arten von Ratschlägen oder Empfehlungen gedacht, die von TradingView bereitgestellt oder gebilligt werden, und stellen diese nicht dar. Lesen Sie mehr in den Nutzungsbedingungen.
Haftungsausschluss
Die Informationen und Veröffentlichungen sind nicht als Finanz-, Anlage-, Handels- oder andere Arten von Ratschlägen oder Empfehlungen gedacht, die von TradingView bereitgestellt oder gebilligt werden, und stellen diese nicht dar. Lesen Sie mehr in den Nutzungsbedingungen.