OPEN-SOURCE SCRIPT
Aktualisiert RSI Dav1zoN
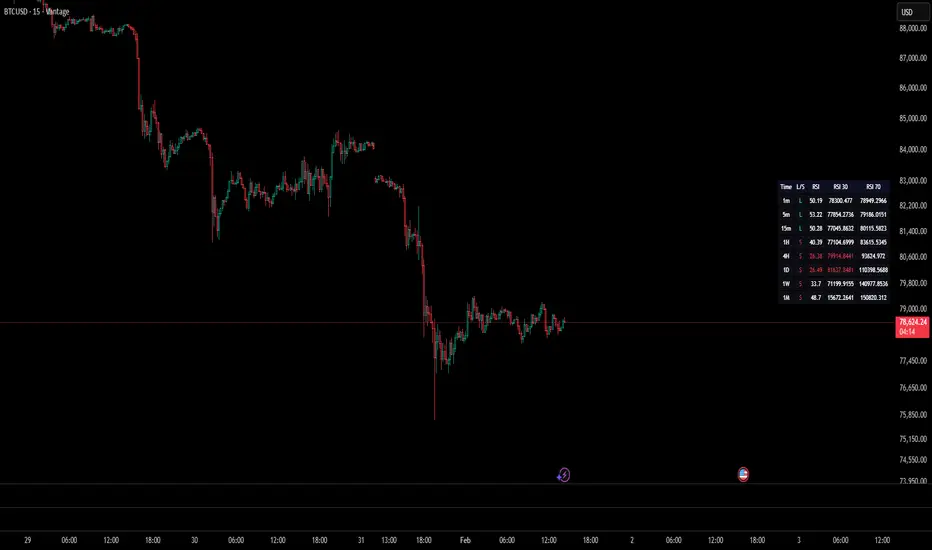
The RSI Grid is a multi-timeframe momentum dashboard designed to give a quick, structured view of market bias across several timeframes at once.
Instead of checking RSI on each timeframe manually, the grid shows direction, RSI value, and projected price levels in one place.
Instead of checking RSI on each timeframe manually, the grid shows direction, RSI value, and projected price levels in one place.
Versionshinweise
The RSI Grid is a multi-timeframe momentum dashboard designed to give a quick, structured view of market bias across several timeframes at once.Instead of checking RSI on each timeframe manually, the grid shows direction, RSI value, and projected price levels in one place.
Versionshinweise
The RSI Grid is a multi-timeframe momentum dashboard designed to give a quick, structured view of market bias across several timeframes at once.Instead of checking RSI on each timeframe manually, the grid shows direction, RSI value, and projected price levels in one place.
Versionshinweise
The RSI Grid is a multi-timeframe momentum dashboard designed to give a quick, structured view of market bias across several timeframes at once.Instead of checking RSI on each timeframe manually, the grid shows direction, RSI value, and projected price levels in one place.
Versionshinweise
COLOR UPDATE Versionshinweise
UPDATE WITH LONG SHORT AT TIMEFRAME Open-source Skript
Ganz im Sinne von TradingView hat dieser Autor sein/ihr Script als Open-Source veröffentlicht. Auf diese Weise können nun auch andere Trader das Script rezensieren und die Funktionalität überprüfen. Vielen Dank an den Autor! Sie können das Script kostenlos verwenden, aber eine Wiederveröffentlichung des Codes unterliegt unseren Hausregeln.

Haftungsausschluss
Die Informationen und Veröffentlichungen sind nicht als Finanz-, Anlage-, Handels- oder andere Arten von Ratschlägen oder Empfehlungen gedacht, die von TradingView bereitgestellt oder gebilligt werden, und stellen diese nicht dar. Lesen Sie mehr in den Nutzungsbedingungen.
Open-source Skript
Ganz im Sinne von TradingView hat dieser Autor sein/ihr Script als Open-Source veröffentlicht. Auf diese Weise können nun auch andere Trader das Script rezensieren und die Funktionalität überprüfen. Vielen Dank an den Autor! Sie können das Script kostenlos verwenden, aber eine Wiederveröffentlichung des Codes unterliegt unseren Hausregeln.
Haftungsausschluss
Die Informationen und Veröffentlichungen sind nicht als Finanz-, Anlage-, Handels- oder andere Arten von Ratschlägen oder Empfehlungen gedacht, die von TradingView bereitgestellt oder gebilligt werden, und stellen diese nicht dar. Lesen Sie mehr in den Nutzungsbedingungen.