OPEN-SOURCE SCRIPT
CRT Range Indicator [Dynamic Period Grid]
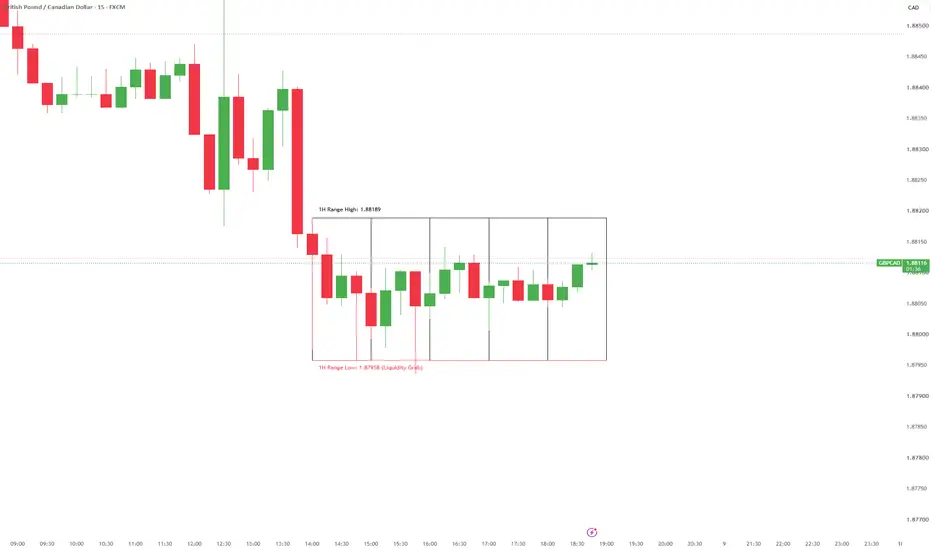
The CRT Indicator [Dynamic Period Grid] is a multi-timeframe tool designed for traders who utilize Candle Range Theory and liquidity concepts.
Instead of cluttering your chart with endless historical lines, this indicator automatically identifies the active "Master CRT Range" on a higher timeframe (HTF) and projects it cleanly onto your lower execution timeframe. It frames the market’s accumulation and manipulation phases into a dynamic, expanding visual grid, allowing you to instantly spot true structural breakouts versus liquidity sweeps.
🧠 How It Works
The Master Candle: The script looks at your chosen Higher Timeframe (e.g., the 1-Hour chart) and establishes the High and Low of the most recently closed candle.
The Grid: It draws a clean bounding box around this range on your current lower timeframe (e.g., the 15m chart). As long as subsequent HTF candles form inside this range, the box dynamically expands to the right, dropping a new vertical grid line to mark the passage of each new HTF period.
The Breakout Reset: The Master Range is only considered "broken" if a HTF candle closes outside the boundaries. When a true close happens, the old grid is wiped away, and a brand new Master Range is established instantly.
🔥 Key Features
Liquidity Grab Detection (The Latch System): If price wicks past the range boundary but fails to close outside of it, the indicator permanently "latches" a warning onto the chart. The breached horizontal line will change to your designated Breach Color (e.g., Green for a high sweep, Red for a low sweep), and the text label will automatically update to explicitly call out a "(Liquidity Grab)".
Dynamic Grid Expansion: Stop guessing where you are in the session. The internal vertical lines keep your lower timeframe perfectly synced with the higher timeframe's pacing.
Unified & Clean Visuals: The base grid remains a single, solid color (defaulted to Yellow) to keep your charts clean. Only the specific levels that have been tested/swept will change color, drawing your eye exactly where it needs to be.
Repaint-Free Multi-Timeframe: Built with secure historical data referencing, ensuring the indicator plots accurately in real-time without looking into the future or repainting historical data.
⚙️ Settings
Master Timeframe: Select the HTF you want to define your range (e.g., 60 for 1H, 240 for 4H). The text labels will automatically update to reflect your choice.
Base Line/Text Color: Customize the default color of the unbroken range grid.
Breach Colors: Fully customize the visual alerts for when Buy-Side or Sell-Side liquidity is swept.
Line Styles & Widths: Toggle between solid, dashed, or dotted lines to fit your chart aesthetic.
📈 How to Use It
Trading the Sweep: Wait for the boundary line to change color and display "(Liquidity Grab)". Once the sweep is confirmed and price rejects back inside the grid, target the opposite side of the Master Range.
Open-source Skript
Ganz im Sinne von TradingView hat dieser Autor sein/ihr Script als Open-Source veröffentlicht. Auf diese Weise können nun auch andere Trader das Script rezensieren und die Funktionalität überprüfen. Vielen Dank an den Autor! Sie können das Script kostenlos verwenden, aber eine Wiederveröffentlichung des Codes unterliegt unseren Hausregeln.

Haftungsausschluss
Die Informationen und Veröffentlichungen sind nicht als Finanz-, Anlage-, Handels- oder andere Arten von Ratschlägen oder Empfehlungen gedacht, die von TradingView bereitgestellt oder gebilligt werden, und stellen diese nicht dar. Lesen Sie mehr in den Nutzungsbedingungen.
Open-source Skript
Ganz im Sinne von TradingView hat dieser Autor sein/ihr Script als Open-Source veröffentlicht. Auf diese Weise können nun auch andere Trader das Script rezensieren und die Funktionalität überprüfen. Vielen Dank an den Autor! Sie können das Script kostenlos verwenden, aber eine Wiederveröffentlichung des Codes unterliegt unseren Hausregeln.
Haftungsausschluss
Die Informationen und Veröffentlichungen sind nicht als Finanz-, Anlage-, Handels- oder andere Arten von Ratschlägen oder Empfehlungen gedacht, die von TradingView bereitgestellt oder gebilligt werden, und stellen diese nicht dar. Lesen Sie mehr in den Nutzungsbedingungen.