Auto Market Structure & Liquidity by [Itto-Ryu]
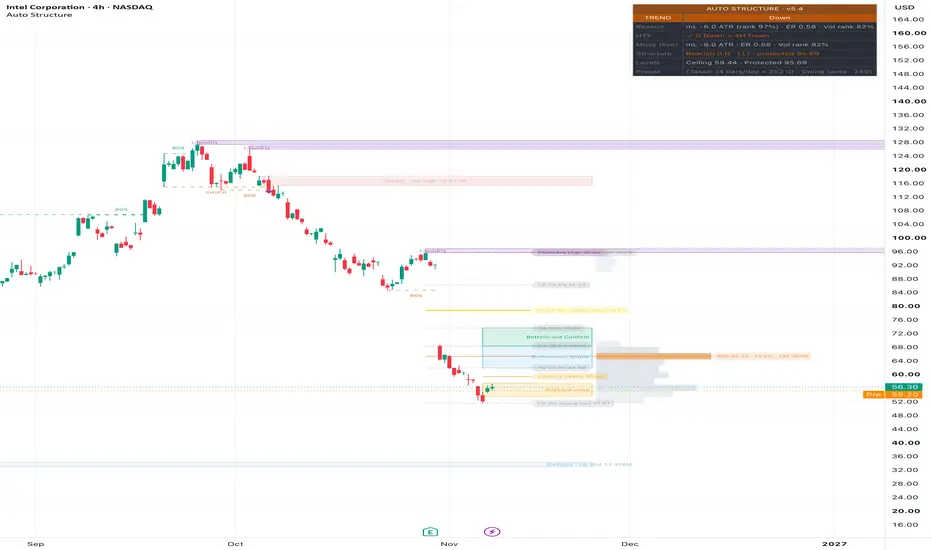
WHAT IT DOES
This indicator reads the market on every closed bar and draws its structure on the chart. It answers four questions in one place:
• Is the market trending, setting up, or unclear?
• Which way does the structure point, and which level would change it?
• How much of the current leg has been retraced?
• Where did that leg trade the most volume?
It describes the chart. It does not forecast direction and it gives no buy or sell signals. It is made for chart readers who want structure, liquidity and volume read the same way on every market and timeframe.
WHAT MAKES IT ORIGINAL
The script is written from scratch. It uses public ideas (ATR, the Kaufman Efficiency Ratio, Dow structure, Fibonacci ratios and volume profile), but it joins them in a new way.
First, the market state decides what is drawn. A quiet market gets a compress box. A trending market gets a pullback zone. An unclear market gets its swing high and low.
Second, everything starts from one level: the Protected level, the level that would change the structure. The Fibonacci leg, the Bottom-out areas and the volume profile all begin there, so 100% always means "this is where the structure turns".
Third, volume is linked to structure. Each order block shows how much volume traded inside it, and Smart POC keeps a level only when its leg had above-average volume.
Finally, one set of rules fits every market. Momentum and volatility are measured in ATR and compared with about one year of the same market's own history.
HOW IT WORKS
Market state
On each closed bar the script measures three things. Momentum is how far price moved, in ATR units. Path quality is the Efficiency Ratio: a straight move scores high, a choppy one scores low. Volatility is ATR(14). Momentum and volatility are ranked against about one year of bars. Together they place the market in one of 12 states, grouped as TREND, READY or WAIT. A state must last a few bars before it can change, so it does not flicker.
Structure
A swing high or low is confirmed only after price turns back by at least 2 × ATR (the Swing size setting). When a bar closes beyond the last swing in the trend's direction, that is a BOS (break of structure). The Protected level then moves to the most extreme price on the other side, for example the lowest low since the broken swing high. When a bar closes beyond the Protected level, that is a CHoCH (change of character), and the structure turns. Only closes count. A wick is not a break.
The leg
The Fibonacci retracement runs from the Protected level (100%) to the furthest price since then (0%). The 61.8% level is drawn in gold. In a falling structure, two Bottom-out areas show how much of the drop has been recovered: Stable is 23.6–38.2% of the leg, Confirm is 38.2–50%. They measure depth. They are not support levels.
Liquidity
Thin purple zones sit just beyond recent swing highs and lows that price has not yet taken. If a wick goes through a zone and the bar closes back inside, the script marks a sweep with ◆.
Volume layers (need a symbol with volume)
An order block is the last opposite-colour candle before a BOS or CHoCH move. Its label shows the volume traded inside it, graded low, mid or high. Low-volume blocks are hidden by default, and a block is removed when a bar closes through it.
The leg volume profile shows how much volume traded at each price, from the Protected level to now. The POC is the busiest price. The value area holds 70% of the volume.
Smart POC levels keep the POC of each finished leg, but only if that leg's volume was at least the average of the last 20 legs.
Volume is estimated from chart bars, not tick data. These layers show where price traded. They are reference levels, not turning points.
THE 12 STATES
• TREND: Up, Down, Breakout Up, Breakdown, Sideways Up, Sideways Down
• READY: Pullback Up, Pullback Down, Compressed
• WAIT: Chop, Volatile, Neutral
Each name describes what price has been doing. None of them is a signal.
HOW TO USE IT
Open Settings, ① Start here, and make two choices.
Market: Classic (stocks, indices), Crypto (7-day markets), FX & Gold, or Custom (type your market's trading days per year).
Style: leave it on Auto to follow the chart timeframe, or pick Scalp, Swing or Position yourself.
The last dashboard row, Preset, shows your settings. The dashboard says "warming up" until about one year of bars is loaded.
Then read the chart:
1. The dashboard tells you the state: TREND, READY or WAIT.
2. The Structure row tells you Bullish or Bearish and names the Protected level.
3. While bars close on the right side of the Protected level, the structure has not changed.
4. In a falling structure, the Bottom-out ✓ marks show how far price has recovered.
5. The volume layers show where the leg traded most.
6. Set alerts, then read the chart yourself.
ON THE CHART
• Dashed lines: BOS, CHoCH and the Protected level
• Grey dotted lines: Fibonacci levels, 61.8% in gold
• Light blue and green boxes: Bottom-out Stable and Confirm
• Purple boxes: liquidity zones, ◆ = sweep
• Blue and red boxes: demand and supply order blocks
• Rows right of price with an orange line: leg volume profile and POC
• Orange lines: Smart POC levels
• Grey box: compress box, with Breakout and Breakdown lines
• Amber box: pullback zone, with its Floor or Ceiling
Off by default: Fibonacci extension, confluence shading, candle colours, and an Expected range row (a typical range width for the next 10 bars, not a direction).
WHY SOME DRAWINGS APPEAR BACK IN TIME
Some things can only be confirmed a few bars after they happen. When they are confirmed, the script draws them from the bar where they started.
• A swing is confirmed only after price turns back by Swing size × ATR. Its line then starts at the swing bar.
• Pivots for liquidity zones are confirmed a few bars later and are drawn from the pivot bar.
• An order block is found when a BOS or CHoCH closes. Its box is drawn from the earlier candle that started the move.
• A Smart POC line is drawn from the end of its leg once the leg is confirmed.
This never changes past states, breaks or alerts. Each one is decided on the bar where it is confirmed. When you look back in history, remember that a swing line drawn at a bar could not be seen on that bar in real time.
ALERTS
In the alert dialog: Group → TREND / READY / WAIT, Breakout Up, Breakdown, BOS, CHoCH, Liquidity sweep, Order block touched, Bottom-out Stable ✓, Bottom-out Confirm ✓.
For JSON messages, choose "Any alert() function call". All alerts fire once when the bar closes.
LIMITATIONS
• It describes the chart. It does not predict it.
• It needs about one year of bars before the states settle.
• The newest swing appears with a delay, because it must be confirmed first.
• Volume layers need volume data and are estimated from chart bars.
• Thresholds are fixed. They are not tuned for each market.
• On the forming bar, the Fibonacci 0% level, the ✓ marks, the volume profile and the Move (live) row can still change.
COMMON MISTAKES
• Reading the forming bar as final. Wait for the close.
• Treating a ✓, the golden ratio, an order block or a POC as a buy or sell signal.
• Expecting the Fibonacci levels to stay fixed. They move with new highs or lows and reset after each BOS or CHoCH.
• Loading too little history.
• Using Heikin Ashi, Renko, Range, Point & Figure or Kagi charts. Use standard candles.
DISCLOSURE
• Repaint: no for states, BOS, CHoCH, the Protected level, sweeps, order blocks, Smart POC and alerts. All are decided on closed bars. Some drawings are placed back in time after confirmation, as explained above.
• The HTF row uses the last closed higher-timeframe bar (offset by one bar, the standard non-repainting method), so it never shows future data.
• Use on standard candle charts only.
DISCLAIMER
For education and information only. Not financial advice, and not a recommendation to buy, sell or hold anything. Readings describe the past and present chart. Past behaviour does not guarantee future results. Trading involves risk. You are responsible for your own decisions.
This indicator reads the market on every closed bar and draws its structure on the chart. It answers four questions in one place:
• Is the market trending, setting up, or unclear?
• Which way does the structure point, and which level would change it?
• How much of the current leg has been retraced?
• Where did that leg trade the most volume?
It describes the chart. It does not forecast direction and it gives no buy or sell signals. It is made for chart readers who want structure, liquidity and volume read the same way on every market and timeframe.
WHAT MAKES IT ORIGINAL
The script is written from scratch. It uses public ideas (ATR, the Kaufman Efficiency Ratio, Dow structure, Fibonacci ratios and volume profile), but it joins them in a new way.
First, the market state decides what is drawn. A quiet market gets a compress box. A trending market gets a pullback zone. An unclear market gets its swing high and low.
Second, everything starts from one level: the Protected level, the level that would change the structure. The Fibonacci leg, the Bottom-out areas and the volume profile all begin there, so 100% always means "this is where the structure turns".
Third, volume is linked to structure. Each order block shows how much volume traded inside it, and Smart POC keeps a level only when its leg had above-average volume.
Finally, one set of rules fits every market. Momentum and volatility are measured in ATR and compared with about one year of the same market's own history.
HOW IT WORKS
Market state
On each closed bar the script measures three things. Momentum is how far price moved, in ATR units. Path quality is the Efficiency Ratio: a straight move scores high, a choppy one scores low. Volatility is ATR(14). Momentum and volatility are ranked against about one year of bars. Together they place the market in one of 12 states, grouped as TREND, READY or WAIT. A state must last a few bars before it can change, so it does not flicker.
Structure
A swing high or low is confirmed only after price turns back by at least 2 × ATR (the Swing size setting). When a bar closes beyond the last swing in the trend's direction, that is a BOS (break of structure). The Protected level then moves to the most extreme price on the other side, for example the lowest low since the broken swing high. When a bar closes beyond the Protected level, that is a CHoCH (change of character), and the structure turns. Only closes count. A wick is not a break.
The leg
The Fibonacci retracement runs from the Protected level (100%) to the furthest price since then (0%). The 61.8% level is drawn in gold. In a falling structure, two Bottom-out areas show how much of the drop has been recovered: Stable is 23.6–38.2% of the leg, Confirm is 38.2–50%. They measure depth. They are not support levels.
Liquidity
Thin purple zones sit just beyond recent swing highs and lows that price has not yet taken. If a wick goes through a zone and the bar closes back inside, the script marks a sweep with ◆.
Volume layers (need a symbol with volume)
An order block is the last opposite-colour candle before a BOS or CHoCH move. Its label shows the volume traded inside it, graded low, mid or high. Low-volume blocks are hidden by default, and a block is removed when a bar closes through it.
The leg volume profile shows how much volume traded at each price, from the Protected level to now. The POC is the busiest price. The value area holds 70% of the volume.
Smart POC levels keep the POC of each finished leg, but only if that leg's volume was at least the average of the last 20 legs.
Volume is estimated from chart bars, not tick data. These layers show where price traded. They are reference levels, not turning points.
THE 12 STATES
• TREND: Up, Down, Breakout Up, Breakdown, Sideways Up, Sideways Down
• READY: Pullback Up, Pullback Down, Compressed
• WAIT: Chop, Volatile, Neutral
Each name describes what price has been doing. None of them is a signal.
HOW TO USE IT
Open Settings, ① Start here, and make two choices.
Market: Classic (stocks, indices), Crypto (7-day markets), FX & Gold, or Custom (type your market's trading days per year).
Style: leave it on Auto to follow the chart timeframe, or pick Scalp, Swing or Position yourself.
The last dashboard row, Preset, shows your settings. The dashboard says "warming up" until about one year of bars is loaded.
Then read the chart:
1. The dashboard tells you the state: TREND, READY or WAIT.
2. The Structure row tells you Bullish or Bearish and names the Protected level.
3. While bars close on the right side of the Protected level, the structure has not changed.
4. In a falling structure, the Bottom-out ✓ marks show how far price has recovered.
5. The volume layers show where the leg traded most.
6. Set alerts, then read the chart yourself.
ON THE CHART
• Dashed lines: BOS, CHoCH and the Protected level
• Grey dotted lines: Fibonacci levels, 61.8% in gold
• Light blue and green boxes: Bottom-out Stable and Confirm
• Purple boxes: liquidity zones, ◆ = sweep
• Blue and red boxes: demand and supply order blocks
• Rows right of price with an orange line: leg volume profile and POC
• Orange lines: Smart POC levels
• Grey box: compress box, with Breakout and Breakdown lines
• Amber box: pullback zone, with its Floor or Ceiling
Off by default: Fibonacci extension, confluence shading, candle colours, and an Expected range row (a typical range width for the next 10 bars, not a direction).
WHY SOME DRAWINGS APPEAR BACK IN TIME
Some things can only be confirmed a few bars after they happen. When they are confirmed, the script draws them from the bar where they started.
• A swing is confirmed only after price turns back by Swing size × ATR. Its line then starts at the swing bar.
• Pivots for liquidity zones are confirmed a few bars later and are drawn from the pivot bar.
• An order block is found when a BOS or CHoCH closes. Its box is drawn from the earlier candle that started the move.
• A Smart POC line is drawn from the end of its leg once the leg is confirmed.
This never changes past states, breaks or alerts. Each one is decided on the bar where it is confirmed. When you look back in history, remember that a swing line drawn at a bar could not be seen on that bar in real time.
ALERTS
In the alert dialog: Group → TREND / READY / WAIT, Breakout Up, Breakdown, BOS, CHoCH, Liquidity sweep, Order block touched, Bottom-out Stable ✓, Bottom-out Confirm ✓.
For JSON messages, choose "Any alert() function call". All alerts fire once when the bar closes.
LIMITATIONS
• It describes the chart. It does not predict it.
• It needs about one year of bars before the states settle.
• The newest swing appears with a delay, because it must be confirmed first.
• Volume layers need volume data and are estimated from chart bars.
• Thresholds are fixed. They are not tuned for each market.
• On the forming bar, the Fibonacci 0% level, the ✓ marks, the volume profile and the Move (live) row can still change.
COMMON MISTAKES
• Reading the forming bar as final. Wait for the close.
• Treating a ✓, the golden ratio, an order block or a POC as a buy or sell signal.
• Expecting the Fibonacci levels to stay fixed. They move with new highs or lows and reset after each BOS or CHoCH.
• Loading too little history.
• Using Heikin Ashi, Renko, Range, Point & Figure or Kagi charts. Use standard candles.
DISCLOSURE
• Repaint: no for states, BOS, CHoCH, the Protected level, sweeps, order blocks, Smart POC and alerts. All are decided on closed bars. Some drawings are placed back in time after confirmation, as explained above.
• The HTF row uses the last closed higher-timeframe bar (offset by one bar, the standard non-repainting method), so it never shows future data.
• Use on standard candle charts only.
DISCLAIMER
For education and information only. Not financial advice, and not a recommendation to buy, sell or hold anything. Readings describe the past and present chart. Past behaviour does not guarantee future results. Trading involves risk. You are responsible for your own decisions.

Haftungsausschluss
Die Informationen und Veröffentlichungen sind nicht als Finanz-, Anlage-, Handels- oder andere Arten von Ratschlägen oder Empfehlungen gedacht, die von TradingView bereitgestellt oder gebilligt werden, und stellen diese nicht dar. Lesen Sie mehr in den Nutzungsbedingungen.
Haftungsausschluss
Die Informationen und Veröffentlichungen sind nicht als Finanz-, Anlage-, Handels- oder andere Arten von Ratschlägen oder Empfehlungen gedacht, die von TradingView bereitgestellt oder gebilligt werden, und stellen diese nicht dar. Lesen Sie mehr in den Nutzungsbedingungen.