Aktualisiert
Structural Squeeze & Momentum Engine | InvestMode.io
Overview
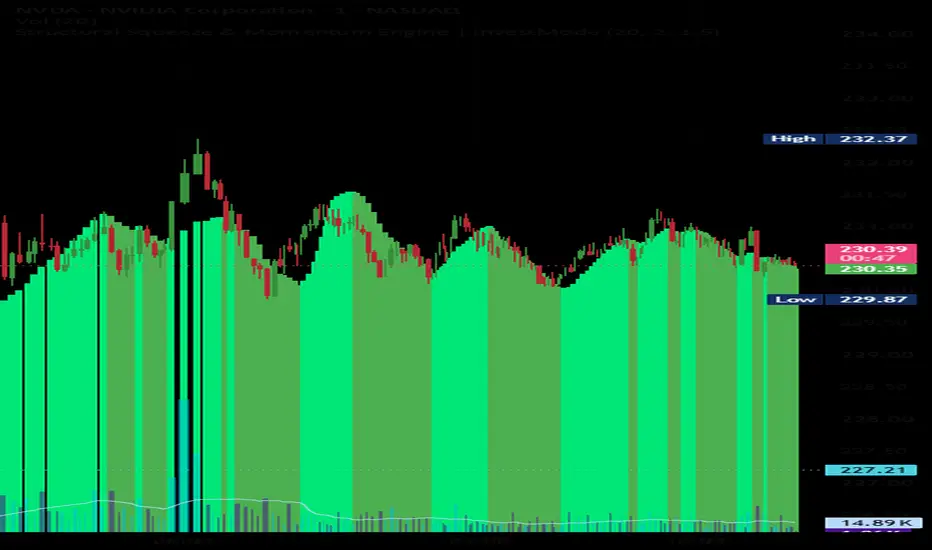
The "Structural Squeeze & Momentum Engine v6" is a high-end volatility compression and directional momentum indicator fully engineered using modern Pine Script v6 standards.
Designed specifically for macro swing traders, this system identifies periods where market volatility contracts to extreme historic lows—signaling institutional position building (accumulation)—and prints a precise visual trigger the exact moment that compressed energy releases into a multi-day trend expansion wave.
Mechanical Performance Modules
1. 🔴🟢 Volatility Compression Tracker (The Squeeze Dot Line):
The engine constantly measures the physical geometric relationship between standard Bollinger Bands and Keltner Channels.
- Red Dot (Squeeze Active): Printed when Bollinger Bands contract completely inside the Keltner Channels. This signifies a historic volatility compression loop where smart money is accumulating positions quietly.
- Green Dot (Squeeze Released): Printed when the bands expand back outside the channels, triggering a high-velocity momentum release vector.
2. 📊 Linear Regression Momentum Histogram:
To determine the directional bias of the squeeze release, the engine plots a smoothed Linear Regression histogram. The color states indicate the exact structural health of the momentum:
- Lime Bars: Strong upward momentum accelerating.
- Green Bars: Upward momentum present but decelerating.
- Maroon Bars: Strong downward momentum accelerating.
- Red Bars: Downward momentum present but decelerating.
3. 🔔 Automated Momentum Release Alert:
Equipped with a strict, type-safe Pine Script v6 boolean alert loop. When the system detects a transition from a compressed squeeze state to a live release on a bar close, a server-side notification is pushed directly to your mobile device or email—allowing you to coordinate your entries instantly without manual chart fatigue.
### Core Swing Execution Loop
1. Deploy the indicator on a structural timeframe (e.g., 4-Hour or 1-Day charts).
2. Monitor your target asset for a string of Red Squeeze Dots, indicating institutional consolidation.
3. Cross-reference this compression with unusual options sweep volume or dark pool accumulation metrics using institutional flow trackers like Unusual Whales.
4. The exact moment the dot switches to Green and the histogram prints a confirmed color vector on a bar close, deploy your position utilizing your automated Robinhood OCO risk brackets.
--------------------------------------------------------------------------------
⚖️ LEGAL DISCLAIMER:
This script code is published open-source strictly for educational and technical illustrative purposes under the operations of Skalehub Inc. It does not constitute investment advice, financial analysis, or an endorsement/recommendation to buy or sell any security. Past performance of mathematical chart configurations does not guarantee future market results. Financial trading involves substantial risk of loss; users assume full personal responsibility for their individual technical setups and execution decisions.
The "Structural Squeeze & Momentum Engine v6" is a high-end volatility compression and directional momentum indicator fully engineered using modern Pine Script v6 standards.
Designed specifically for macro swing traders, this system identifies periods where market volatility contracts to extreme historic lows—signaling institutional position building (accumulation)—and prints a precise visual trigger the exact moment that compressed energy releases into a multi-day trend expansion wave.
Mechanical Performance Modules
1. 🔴🟢 Volatility Compression Tracker (The Squeeze Dot Line):
The engine constantly measures the physical geometric relationship between standard Bollinger Bands and Keltner Channels.
- Red Dot (Squeeze Active): Printed when Bollinger Bands contract completely inside the Keltner Channels. This signifies a historic volatility compression loop where smart money is accumulating positions quietly.
- Green Dot (Squeeze Released): Printed when the bands expand back outside the channels, triggering a high-velocity momentum release vector.
2. 📊 Linear Regression Momentum Histogram:
To determine the directional bias of the squeeze release, the engine plots a smoothed Linear Regression histogram. The color states indicate the exact structural health of the momentum:
- Lime Bars: Strong upward momentum accelerating.
- Green Bars: Upward momentum present but decelerating.
- Maroon Bars: Strong downward momentum accelerating.
- Red Bars: Downward momentum present but decelerating.
3. 🔔 Automated Momentum Release Alert:
Equipped with a strict, type-safe Pine Script v6 boolean alert loop. When the system detects a transition from a compressed squeeze state to a live release on a bar close, a server-side notification is pushed directly to your mobile device or email—allowing you to coordinate your entries instantly without manual chart fatigue.
### Core Swing Execution Loop
1. Deploy the indicator on a structural timeframe (e.g., 4-Hour or 1-Day charts).
2. Monitor your target asset for a string of Red Squeeze Dots, indicating institutional consolidation.
3. Cross-reference this compression with unusual options sweep volume or dark pool accumulation metrics using institutional flow trackers like Unusual Whales.
4. The exact moment the dot switches to Green and the histogram prints a confirmed color vector on a bar close, deploy your position utilizing your automated Robinhood OCO risk brackets.
--------------------------------------------------------------------------------
⚖️ LEGAL DISCLAIMER:
This script code is published open-source strictly for educational and technical illustrative purposes under the operations of Skalehub Inc. It does not constitute investment advice, financial analysis, or an endorsement/recommendation to buy or sell any security. Past performance of mathematical chart configurations does not guarantee future market results. Financial trading involves substantial risk of loss; users assume full personal responsibility for their individual technical setups and execution decisions.
Versionshinweise
Updated name
Haftungsausschluss
Die Informationen und Veröffentlichungen sind nicht als Finanz-, Anlage-, Handels- oder andere Arten von Ratschlägen oder Empfehlungen gedacht, die von TradingView bereitgestellt oder gebilligt werden, und stellen diese nicht dar. Lesen Sie mehr in den Nutzungsbedingungen.
Haftungsausschluss
Die Informationen und Veröffentlichungen sind nicht als Finanz-, Anlage-, Handels- oder andere Arten von Ratschlägen oder Empfehlungen gedacht, die von TradingView bereitgestellt oder gebilligt werden, und stellen diese nicht dar. Lesen Sie mehr in den Nutzungsbedingungen.