Volume Acceptance Bands [PhenLabs]
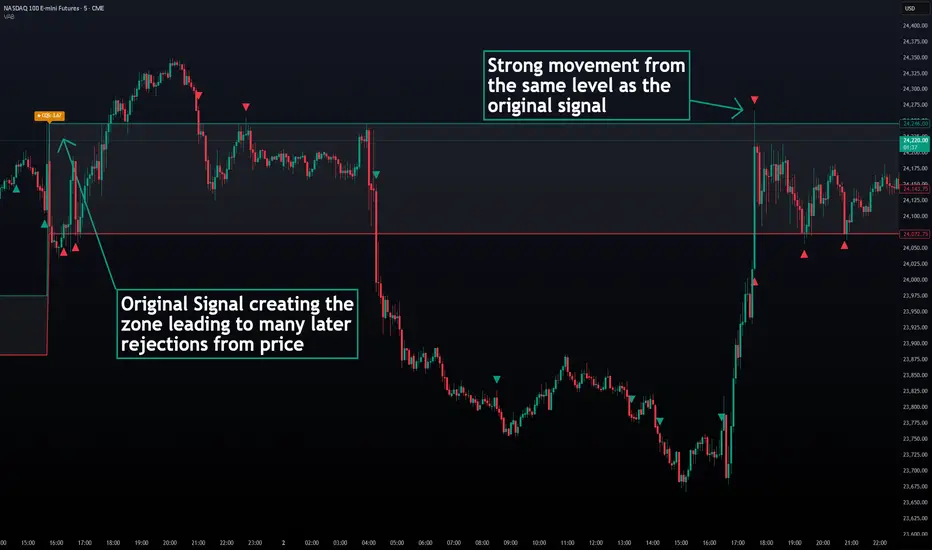
Volume Acceptance Bands [PhenLabs]
v1.0 — Volume cluster detection with 3-state adaptive breakout bands

📌 OVERVIEW
Volume Acceptance Bands uses statistical volume anomaly detection to identify price levels where the market has temporarily “accepted” a range — then tracks what happens when that acceptance breaks. Every bar is assigned one of three exclusive states: Acceptance, Expansion, or Mean-Revert, giving you a clear read on whether the market is building energy, breaking out, or rejecting a move.
The core mechanism is a rolling z-score applied to volume. When volume spikes above a configurable threshold for a configurable number of consecutive bars, those bars form a “cluster” and their combined high/low becomes the acceptance range. The bands persist on the chart until the next qualifying cluster overwrites them.
📊 HOW IT WORKS
v1.0 — Volume cluster detection with 3-state adaptive breakout bands
📌 OVERVIEW
Volume Acceptance Bands uses statistical volume anomaly detection to identify price levels where the market has temporarily “accepted” a range — then tracks what happens when that acceptance breaks. Every bar is assigned one of three exclusive states: Acceptance, Expansion, or Mean-Revert, giving you a clear read on whether the market is building energy, breaking out, or rejecting a move.
The core mechanism is a rolling z-score applied to volume. When volume spikes above a configurable threshold for a configurable number of consecutive bars, those bars form a “cluster” and their combined high/low becomes the acceptance range. The bands persist on the chart until the next qualifying cluster overwrites them.
📊 HOW IT WORKS
- Z-Score Computation
- Each bar’s volume is normalized against a rolling mean and standard deviation over the lookback period
- A bar is flagged as a spike when its z-score exceeds the threshold (default: 2.0)
- Zero-stdev environments (flat volume) are safely handled to prevent division errors
- Cluster Formation
- Consecutive spike bars accumulate into a cluster
- The cluster’s high/low envelope is tracked in real time
- Once the cluster reaches the minimum duration (default: 2 bars), the acceptance range locks in
- A non-spike bar resets the cluster tracker
- Cluster Quality Score (CQS)
- Displayed as a label the moment a new cluster locks in
- Formula: CQS = volume z-score × wick rejection ratio
- Wick rejection ratio measures how strongly price closed toward one extreme of the spike bar
- Higher CQS = stronger cluster = more meaningful acceptance zone
- Three-State Classification
- Acceptance: Price is inside the acceptance range — neutral background, no signal
- Expansion: Price closes (or wicks, user-configurable) beyond the band with optional volume confirmation — bullish teal background + triangle marker
- Mean-Revert: Price breaches a band but closes back inside — bearish red background + triangle marker
- Anti-Repaint Design
- All state assignments and signal markers fire inside barstate.isconfirmed
- No request.security calls — no lookahead of any kind
🔑 POINTS OF INNOVATION- Z-score volume anomaly detection — statistically principled, not a simple MA multiple
- Three-state regime classifier with per-state visual identity (Acceptance / Expansion / Mean-Revert)
- Cluster Quality Score — original composite metric combining volume strength and wick rejection
- Persistent acceptance range — survives until the next qualifying cluster overwrites it
- Breakout confirmation toggle — close-beyond vs wick-beyond prevents wick trap false signals
- Volume confirmation gate for Expansion — optional requirement that breakout bars are themselves volume spikes
🔧 SETTINGS
Volume Cluster Detection- Volume Lookback | Default: 20 | Range: 5–200 | Bars used to compute the rolling z-score baseline
- Z-Score Threshold | Default: 2.0 | Range: 0.5–6.0 | Minimum z-score to classify a bar as a volume spike. Higher = rarer clusters
- Min Cluster Duration | Default: 2 | Range: 1–20 | Consecutive spike bars required to lock in an acceptance range
Breakout Confirmation- Require Close Beyond Band | Default: ON | ON = breakout requires a close beyond the band; OFF = a wick is sufficient
- Require Volume Confirmation for Expansion | Default: ON | Expansion signals also require the breakout bar to be a volume spike
Display- Background Shading | Default: ON | Shades chart background by current market state
- Show Cluster Quality Score | Default: ON | Shows CQS label when a new cluster locks in
- Show Expansion / Mean-Revert Signals | Default: ON | Triangle markers on state-change bars
Colors- Acceptance Background, Expansion Background, Mean-Revert Background
- Upper Band, Lower Band, Band Fill
- Expansion Signal, Mean-Revert Signal
🔥 ALERTS- VAB — Expansion Breakout: fires on confirmed Expansion state bars
- VAB — Mean-Revert Rejection: fires on confirmed Mean-Revert state bars
- VAB — New Cluster Locked: fires the bar a new acceptance zone is established (includes CQS value in message)
🎨 VISUAL GUIDE- Teal upper band = acceptance zone ceiling
- Red lower band = acceptance zone floor
- Filled channel = the active acceptance range
- Teal background = Expansion (confirmed breakout)
- Red background = Mean-Revert (failed breakout / rejection)
- Neutral/gray background = Acceptance (price inside range)
- Orange label = Cluster Quality Score fires when a new zone is established
📖 USAGE NOTES- Works on all markets with reliable volume data: equities, crypto, futures, forex
- Best on 15m, 1H, 4H, and Daily timeframes where volume clusters are most meaningful
- A higher Z-Score Threshold (3.0+) produces fewer but higher-conviction clusters — useful on higher timeframes
- A lower Z-Score Threshold (1.5–1.8) produces more clusters — useful for scalping on lower timeframes
- CQS above 1.5 generally indicates a high-conviction acceptance zone worth watching
- Combine with a trend filter: take Expansion signals in the direction of the prevailing trend only
✅ WORKS WELL WITH- Trend filters (EMA, VWAP) to qualify Expansion direction
- Support/resistance zones to anticipate Mean-Revert locations
- Volatility tools (ATR-based) to size positions on Expansion breakouts
⚠️ DISCLAIMER
This indicator is for educational and research purposes only. It is not financial advice and does not constitute a trading recommendation. Past performance in backtests or historical evaluations does not guarantee future results. Always conduct your own due diligence before making any trading or investment decisions.

TradingView Charting w/ Crypto Systems: phenlabs.com
Join our growing community: discord.gg/phen
All content provided by PhenLabs is for informational & educational purposes only. Past performance does not guarantee future results.
Join our growing community: discord.gg/phen
All content provided by PhenLabs is for informational & educational purposes only. Past performance does not guarantee future results.
Haftungsausschluss
Die Informationen und Veröffentlichungen sind nicht als Finanz-, Anlage-, Handels- oder andere Arten von Ratschlägen oder Empfehlungen gedacht, die von TradingView bereitgestellt oder gebilligt werden, und stellen diese nicht dar. Lesen Sie mehr in den Nutzungsbedingungen.