OPEN-SOURCE SCRIPT
ICT Smart Money Suite
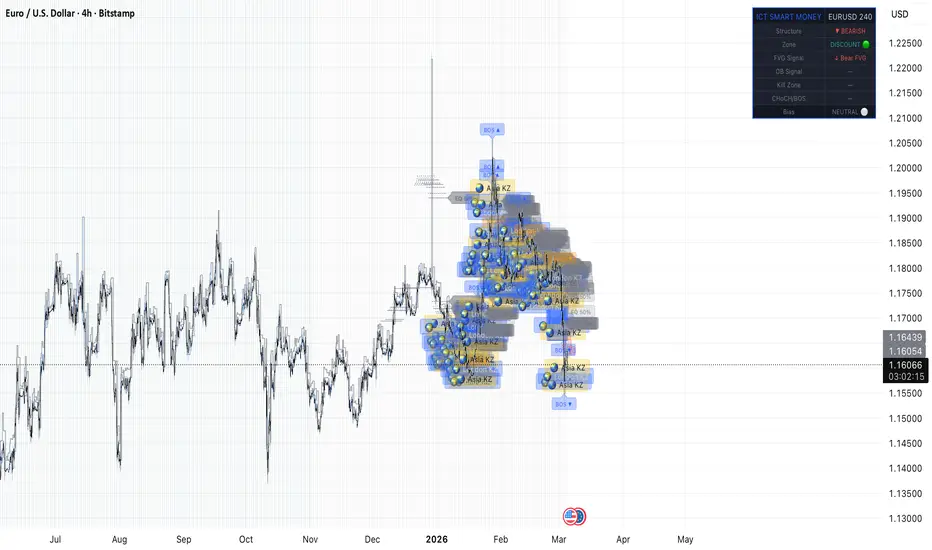
This indicator automatically plots the core concepts of ICT (Inner Circle Trader) Smart Money methodology directly on your TradingView chart. It is designed to help traders identify high-probability trade setups by visualizing institutional order flow, liquidity targets, and market structure in real time.
What it detects and draws:
⚡ Fair Value Gaps (FVG)
Automatically identifies and shades bullish and bearish imbalances — 3-candle formations where price moved too quickly and left an unfilled gap. Green boxes mark bullish FVGs where price may return to before moving higher. Red boxes mark bearish FVGs where price may return to before moving lower.
📦 Order Blocks (OB)
Highlights the last opposing candle before a strong impulse move — the zone where institutional orders are clustered. Blue boxes mark bullish order blocks. Yellow boxes mark bearish order blocks. These are key areas to watch for price reactions and entries.
💧 Liquidity Levels (BSL / SSL)
Detects equal highs and equal lows on the chart — areas where retail stop losses are resting. Dashed green lines mark Buy-Side Liquidity (BSL) above equal highs. Dashed red lines mark Sell-Side Liquidity (SSL) below equal lows. These are the targets institutions hunt before reversing price.
🔄 Change of Character (CHoCH) / Break of Structure (BOS)
Labels key market structure events directly on the chart. CHoCH (orange) signals the first sign of a trend reversal. BOS (blue) confirms continuation of the current trend. These are used as entry triggers after a higher timeframe setup is identified.
📊 Premium / Discount Zones
Draws the equilibrium line (50% of the current swing range) and shades the Optimal Trade Entry (OTE) zone between the 62% and 38% Fibonacci levels. Price above the midpoint is in premium — look to sell. Price below is in discount — look to buy.
⏱ Kill Zones
Highlights the three ICT kill zone sessions with colored backgrounds — Asian (yellow), London (blue), and New York (green) — the time windows when institutional activity and volatility are highest. Also marks the Silver Bullet window (10–11 AM EST), ICT's highest-probability intraday setup window.
🎯 Session High / Low
Plots the current day's developing high and low as step lines — key reference levels for liquidity and range.
📋 Dashboard Table
A real-time overlay table in the top right corner of your chart showing: current market structure (bullish/bearish), premium or discount zone status, active FVG and OB signals, current kill zone, latest CHoCH/BOS event, and an overall bias score combining all signals into a single STRONG LONG, STRONG SHORT, or NEUTRAL reading.
What it detects and draws:
⚡ Fair Value Gaps (FVG)
Automatically identifies and shades bullish and bearish imbalances — 3-candle formations where price moved too quickly and left an unfilled gap. Green boxes mark bullish FVGs where price may return to before moving higher. Red boxes mark bearish FVGs where price may return to before moving lower.
📦 Order Blocks (OB)
Highlights the last opposing candle before a strong impulse move — the zone where institutional orders are clustered. Blue boxes mark bullish order blocks. Yellow boxes mark bearish order blocks. These are key areas to watch for price reactions and entries.
💧 Liquidity Levels (BSL / SSL)
Detects equal highs and equal lows on the chart — areas where retail stop losses are resting. Dashed green lines mark Buy-Side Liquidity (BSL) above equal highs. Dashed red lines mark Sell-Side Liquidity (SSL) below equal lows. These are the targets institutions hunt before reversing price.
🔄 Change of Character (CHoCH) / Break of Structure (BOS)
Labels key market structure events directly on the chart. CHoCH (orange) signals the first sign of a trend reversal. BOS (blue) confirms continuation of the current trend. These are used as entry triggers after a higher timeframe setup is identified.
📊 Premium / Discount Zones
Draws the equilibrium line (50% of the current swing range) and shades the Optimal Trade Entry (OTE) zone between the 62% and 38% Fibonacci levels. Price above the midpoint is in premium — look to sell. Price below is in discount — look to buy.
⏱ Kill Zones
Highlights the three ICT kill zone sessions with colored backgrounds — Asian (yellow), London (blue), and New York (green) — the time windows when institutional activity and volatility are highest. Also marks the Silver Bullet window (10–11 AM EST), ICT's highest-probability intraday setup window.
🎯 Session High / Low
Plots the current day's developing high and low as step lines — key reference levels for liquidity and range.
📋 Dashboard Table
A real-time overlay table in the top right corner of your chart showing: current market structure (bullish/bearish), premium or discount zone status, active FVG and OB signals, current kill zone, latest CHoCH/BOS event, and an overall bias score combining all signals into a single STRONG LONG, STRONG SHORT, or NEUTRAL reading.
Open-source Skript
Ganz im Sinne von TradingView hat dieser Autor sein/ihr Script als Open-Source veröffentlicht. Auf diese Weise können nun auch andere Trader das Script rezensieren und die Funktionalität überprüfen. Vielen Dank an den Autor! Sie können das Script kostenlos verwenden, aber eine Wiederveröffentlichung des Codes unterliegt unseren Hausregeln.

Haftungsausschluss
Die Informationen und Veröffentlichungen sind nicht als Finanz-, Anlage-, Handels- oder andere Arten von Ratschlägen oder Empfehlungen gedacht, die von TradingView bereitgestellt oder gebilligt werden, und stellen diese nicht dar. Lesen Sie mehr in den Nutzungsbedingungen.
Open-source Skript
Ganz im Sinne von TradingView hat dieser Autor sein/ihr Script als Open-Source veröffentlicht. Auf diese Weise können nun auch andere Trader das Script rezensieren und die Funktionalität überprüfen. Vielen Dank an den Autor! Sie können das Script kostenlos verwenden, aber eine Wiederveröffentlichung des Codes unterliegt unseren Hausregeln.
Haftungsausschluss
Die Informationen und Veröffentlichungen sind nicht als Finanz-, Anlage-, Handels- oder andere Arten von Ratschlägen oder Empfehlungen gedacht, die von TradingView bereitgestellt oder gebilligt werden, und stellen diese nicht dar. Lesen Sie mehr in den Nutzungsbedingungen.