OPEN-SOURCE SCRIPT
Shaakuni - Swing Liquidity Levels & Sweeps
Overview
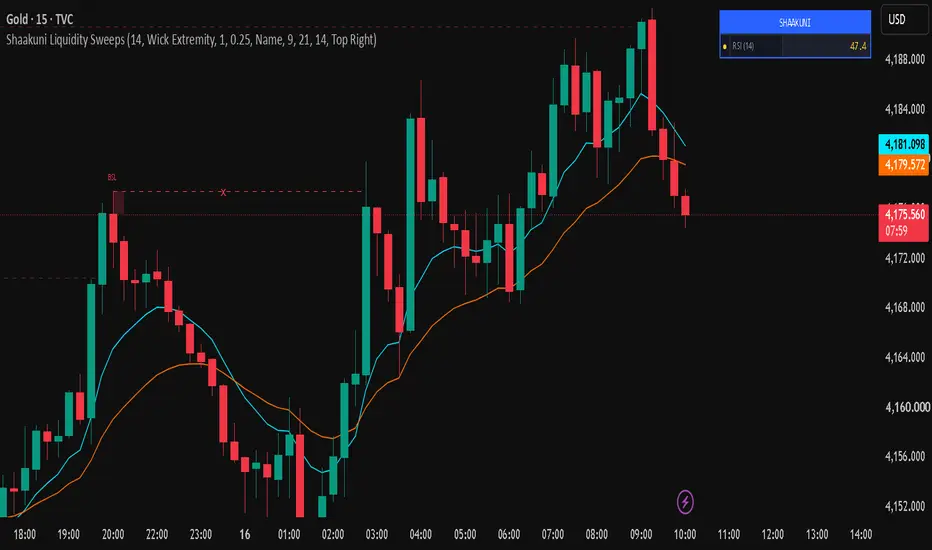
Shaakuni - Swing Liquidity Levels & Sweeps marks swing highs and swing lows as liquidity levels, tracks whether price has swept or broken them, and groups very close swing levels into equal highs and equal lows. It also includes two optional extras: a fast and slow EMA, and a small RSI readout panel. It does not generate buy or sell signals and it does not predict reversals.
Key concepts
Liquidity levels: many traders place stop orders just beyond obvious swing highs and swing lows. Because of this, these levels are often watched as areas where price may pause, reverse or accelerate. The script marks them so you do not have to draw them by hand.
BSL and SSL: BSL (buy-side liquidity) is a swing high level, where stops of short positions and buy breakout orders may sit. SSL (sell-side liquidity) is a swing low level, where stops of long positions and sell breakout orders may sit.
EQH and EQL: when two swing highs (or two swing lows) form at nearly the same price, the level is relabelled EQH (equal highs) or EQL (equal lows). Many traders view equal levels as more obvious liquidity.
Sweep and break: a level is swept when price trades beyond it but the bar closes back on the original side. A level is broken when a bar closes beyond it. A swept or broken level stops extending and is drawn dashed; a broken level is also dimmed.
How the levels are calculated
1. A swing high or swing low is confirmed with a pivot using "Swing Length" (default 14 bars on each side). Because a pivot needs those bars to confirm, a level can appear no earlier than 14 bars after the swing formed, and it is drawn back on the swing candle.
2. Each level gets a zone. With "Wick Extremity" the zone runs from the swing extreme to the highest (or lowest) of the swing candle's open and close. With "Full Range" it covers the swing candle's whole range.
3. If a new swing forms within a tolerance of an existing active level on the same side (default 0.25 x ATR(14)), the two are merged and relabelled EQH or EQL instead of drawing a second line.
4. On every closed bar, a bar whose range overlaps the zone counts as a touch. The zone box grows one bar to the right per touch, and "Volume" label mode shows the total volume of those touching bars.
5. By default a level is displayed only after price has touched it at least once ("Min Touches To Show Level" = 1). Set it to 0 to see fresh untouched levels too.
6. A level is then closed as swept (high above a BSL level or low below an SSL level with the close back inside) or broken (close beyond the level). Up to 80 levels are tracked at a time.
Optional extras
EMA lines: a fast EMA (default 9) and slow EMA (default 21) of the close are plotted. They are standard exponential moving averages and are not used by the liquidity logic. They are included so a trend reference can be viewed on the same chart, and can be switched off.
RSI panel: a small table in the corner shows RSI (default length 14), coloured red above 70, teal below 30 and amber otherwise. It is a plain RSI readout, not used by the liquidity logic, and can be switched off.
How to use it
For example, on a 15-minute chart, look at which swing levels are still active above and below price and which have already been swept. A level that was swept and closed back inside shows that price took out the stops and rejected the level on that bar; a broken level shows that price accepted beyond it. Many traders combine references like these with their own confirmation and risk rules; the script is meant as a map, not a trade plan. Label mode can show the name, name plus price, or touch volume. Colours, swing length, zone type and tolerance are adjustable.
Alerts
Two alert conditions are available, one for buy-side liquidity swept and one for sell-side liquidity swept. They fire when the bar closes.
Why it is built this way
Swing highs and lows, equal levels, sweeps, EMAs and RSI are all widely used, and this script does not claim to have invented them. What it adds is one implementation that tracks each swing level through its whole life (active, touched, swept or broken), merges close levels using an ATR-based tolerance, and shows touch counts and volume on the zone. The source code is open so you can verify each step.
Limitations
Levels are placed after the pivot is confirmed, so they appear at least 14 bars (or your chosen swing length) after the swing, drawn on the earlier candle. Touches are counted only after the level has been confirmed. The EMA lines and RSI panel use the live bar and can change until it closes, while the liquidity engine only changes on closed bars. Volume labels depend on the data feed; some instruments provide little or no volume. A sweep does not mean price will reverse, and a level that is not swept can still fail. Only the most recent 80 levels are tracked, and TradingView limits the number of lines, boxes and labels, so the oldest drawings may disappear. This is a visual aid and not financial advice.
Shaakuni - Swing Liquidity Levels & Sweeps marks swing highs and swing lows as liquidity levels, tracks whether price has swept or broken them, and groups very close swing levels into equal highs and equal lows. It also includes two optional extras: a fast and slow EMA, and a small RSI readout panel. It does not generate buy or sell signals and it does not predict reversals.
Key concepts
Liquidity levels: many traders place stop orders just beyond obvious swing highs and swing lows. Because of this, these levels are often watched as areas where price may pause, reverse or accelerate. The script marks them so you do not have to draw them by hand.
BSL and SSL: BSL (buy-side liquidity) is a swing high level, where stops of short positions and buy breakout orders may sit. SSL (sell-side liquidity) is a swing low level, where stops of long positions and sell breakout orders may sit.
EQH and EQL: when two swing highs (or two swing lows) form at nearly the same price, the level is relabelled EQH (equal highs) or EQL (equal lows). Many traders view equal levels as more obvious liquidity.
Sweep and break: a level is swept when price trades beyond it but the bar closes back on the original side. A level is broken when a bar closes beyond it. A swept or broken level stops extending and is drawn dashed; a broken level is also dimmed.
How the levels are calculated
1. A swing high or swing low is confirmed with a pivot using "Swing Length" (default 14 bars on each side). Because a pivot needs those bars to confirm, a level can appear no earlier than 14 bars after the swing formed, and it is drawn back on the swing candle.
2. Each level gets a zone. With "Wick Extremity" the zone runs from the swing extreme to the highest (or lowest) of the swing candle's open and close. With "Full Range" it covers the swing candle's whole range.
3. If a new swing forms within a tolerance of an existing active level on the same side (default 0.25 x ATR(14)), the two are merged and relabelled EQH or EQL instead of drawing a second line.
4. On every closed bar, a bar whose range overlaps the zone counts as a touch. The zone box grows one bar to the right per touch, and "Volume" label mode shows the total volume of those touching bars.
5. By default a level is displayed only after price has touched it at least once ("Min Touches To Show Level" = 1). Set it to 0 to see fresh untouched levels too.
6. A level is then closed as swept (high above a BSL level or low below an SSL level with the close back inside) or broken (close beyond the level). Up to 80 levels are tracked at a time.
Optional extras
EMA lines: a fast EMA (default 9) and slow EMA (default 21) of the close are plotted. They are standard exponential moving averages and are not used by the liquidity logic. They are included so a trend reference can be viewed on the same chart, and can be switched off.
RSI panel: a small table in the corner shows RSI (default length 14), coloured red above 70, teal below 30 and amber otherwise. It is a plain RSI readout, not used by the liquidity logic, and can be switched off.
How to use it
For example, on a 15-minute chart, look at which swing levels are still active above and below price and which have already been swept. A level that was swept and closed back inside shows that price took out the stops and rejected the level on that bar; a broken level shows that price accepted beyond it. Many traders combine references like these with their own confirmation and risk rules; the script is meant as a map, not a trade plan. Label mode can show the name, name plus price, or touch volume. Colours, swing length, zone type and tolerance are adjustable.
Alerts
Two alert conditions are available, one for buy-side liquidity swept and one for sell-side liquidity swept. They fire when the bar closes.
Why it is built this way
Swing highs and lows, equal levels, sweeps, EMAs and RSI are all widely used, and this script does not claim to have invented them. What it adds is one implementation that tracks each swing level through its whole life (active, touched, swept or broken), merges close levels using an ATR-based tolerance, and shows touch counts and volume on the zone. The source code is open so you can verify each step.
Limitations
Levels are placed after the pivot is confirmed, so they appear at least 14 bars (or your chosen swing length) after the swing, drawn on the earlier candle. Touches are counted only after the level has been confirmed. The EMA lines and RSI panel use the live bar and can change until it closes, while the liquidity engine only changes on closed bars. Volume labels depend on the data feed; some instruments provide little or no volume. A sweep does not mean price will reverse, and a level that is not swept can still fail. Only the most recent 80 levels are tracked, and TradingView limits the number of lines, boxes and labels, so the oldest drawings may disappear. This is a visual aid and not financial advice.
Open-source Skript
Ganz im Sinne von TradingView hat dieser Autor sein/ihr Script als Open-Source veröffentlicht. Auf diese Weise können nun auch andere Trader das Script rezensieren und die Funktionalität überprüfen. Vielen Dank an den Autor! Sie können das Script kostenlos verwenden, aber eine Wiederveröffentlichung des Codes unterliegt unseren Hausregeln.

Haftungsausschluss
Die Informationen und Veröffentlichungen sind nicht als Finanz-, Anlage-, Handels- oder andere Arten von Ratschlägen oder Empfehlungen gedacht, die von TradingView bereitgestellt oder gebilligt werden, und stellen diese nicht dar. Lesen Sie mehr in den Nutzungsbedingungen.
Open-source Skript
Ganz im Sinne von TradingView hat dieser Autor sein/ihr Script als Open-Source veröffentlicht. Auf diese Weise können nun auch andere Trader das Script rezensieren und die Funktionalität überprüfen. Vielen Dank an den Autor! Sie können das Script kostenlos verwenden, aber eine Wiederveröffentlichung des Codes unterliegt unseren Hausregeln.
Haftungsausschluss
Die Informationen und Veröffentlichungen sind nicht als Finanz-, Anlage-, Handels- oder andere Arten von Ratschlägen oder Empfehlungen gedacht, die von TradingView bereitgestellt oder gebilligt werden, und stellen diese nicht dar. Lesen Sie mehr in den Nutzungsbedingungen.