OPEN-SOURCE SCRIPT
ZigZag with Real-Time Confirmation Stats
Slide 1: Title Slide
Title: Real-Time Confirmation Backtesting
Subtitle: Eliminating Look-Ahead Bias and Repainting Illusions in Swing Trading Indicators
Presenter / Author: Gogaz
Target Indicator: Pine Script v6 Advanced ZigZag Analysis
Slide 2: The Problem – The "ZigZag Illusion"Why Standard ZigZag Metrics Lie to YouThe Repainting Paradox: Standard ZigZag indicators draw lines retroactively from absolute low to absolute high.
The Execution Myth: Standard stats log profits starting from the absolute lowest bar (Bar 0).
The Harsh Reality: You cannot buy at Bar 0 because the indicator hasn't triggered yet
!The Danger: Backtests based on standard ZigZag create a false sense of high performance and mask severe strategy lag.
Key Takeaway: A strategy based on retroactive labels measures historical perfection, not tradeable edge.
Slide 3: The Solution – "Confirmation Time"
TrackingMeasuring Performance from the Moment of ActionShift in Metric Baseline: Instead of measuring gains from the absolute low, performance starts on the bar where the pivot actually confirms.Real-Time Data Capture: Logs the exact execution price (close) on the trigger bar.
Accounting for Lag: Converts indicator delay into a measurable metric called "Lag Cost."Realistic Risk Parameters: Stop-loss distances are measured from the entry bar back to the swing low, providing accurate Risk-to-Reward (R:R) ratios.
Slide 4: Side-by-Side ComparisonIdealized Performance vs. Real Tradeable EdgeMetric DimensionTheoretical (Standard)Confirmed (Our Approach)
Start PointAbsolute Swing Low / HighLive Confirmation Bar CloseLook-Ahead BiasHigh (Repaints retroactively)Zero (Bar-by-bar real-time)
Measured Move SizeFull Peak-to-Trough SwingRemaining Tradeable PortionSlippage & LagIgnored (Assumes 0 lag)Measured directly as Lag CostPractical UtilityChart visual aid onlyValid for Live Trading & Automation
Slide 5: The On-Chart Live Analytics Table
Instant Statistical Breakdown at a Glance
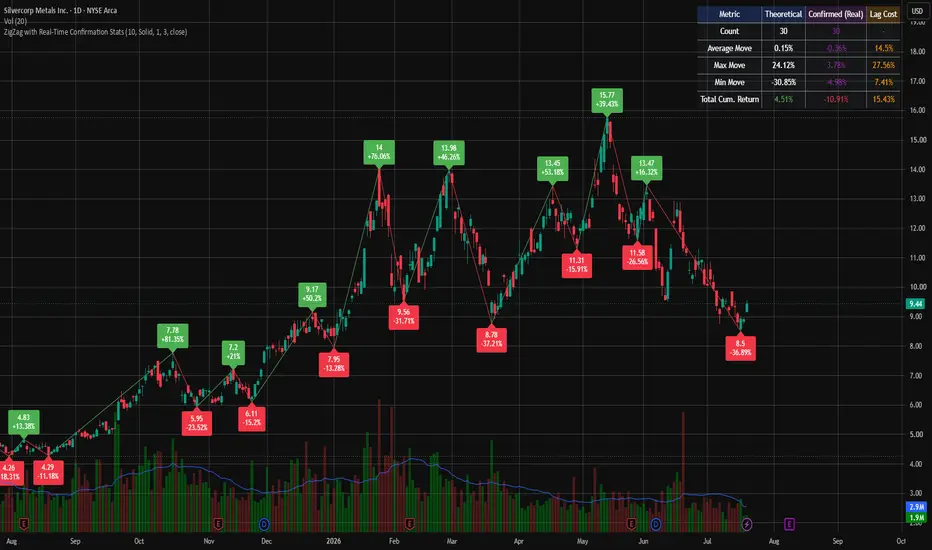
The script features a dynamic, real-time statistical dashboard fixed to the upper-right corner of your chart:
Count: Total confirmed swing legs evaluated across your custom date range.
Average Move: Compares peak-to-trough returns against actual captured returns.
Max / Min Move: Evaluates extreme market swings vs. actual real-time outcomes.
Total Cumulative Return: Demonstrates the cumulative difference between perfection and live execution.
Interactive Tooltips: Hovering over any cell reveals underlying math formulas and metric definitions.
Slide 6: Key Benefits & Strategic Use Cases
Parameter Optimization: Tune your ZigZag depth/period by finding the lowest Lag Cost without increasing false signals.
Realistic Backtesting: Feed realistic confirmation entry prices directly into strategy engines for accurate win rates.
Better Risk Management: Account for the "confirmation gap" between entry price and the swing pivot stop-loss.
FOR EDUCATIONAL USE ONLY....
NOT FINANCIAL ADVICE
Title: Real-Time Confirmation Backtesting
Subtitle: Eliminating Look-Ahead Bias and Repainting Illusions in Swing Trading Indicators
Presenter / Author: Gogaz
Target Indicator: Pine Script v6 Advanced ZigZag Analysis
Slide 2: The Problem – The "ZigZag Illusion"Why Standard ZigZag Metrics Lie to YouThe Repainting Paradox: Standard ZigZag indicators draw lines retroactively from absolute low to absolute high.
The Execution Myth: Standard stats log profits starting from the absolute lowest bar (Bar 0).
The Harsh Reality: You cannot buy at Bar 0 because the indicator hasn't triggered yet
!The Danger: Backtests based on standard ZigZag create a false sense of high performance and mask severe strategy lag.
Key Takeaway: A strategy based on retroactive labels measures historical perfection, not tradeable edge.
Slide 3: The Solution – "Confirmation Time"
TrackingMeasuring Performance from the Moment of ActionShift in Metric Baseline: Instead of measuring gains from the absolute low, performance starts on the bar where the pivot actually confirms.Real-Time Data Capture: Logs the exact execution price (close) on the trigger bar.
Accounting for Lag: Converts indicator delay into a measurable metric called "Lag Cost."Realistic Risk Parameters: Stop-loss distances are measured from the entry bar back to the swing low, providing accurate Risk-to-Reward (R:R) ratios.
Slide 4: Side-by-Side ComparisonIdealized Performance vs. Real Tradeable EdgeMetric DimensionTheoretical (Standard)Confirmed (Our Approach)
Start PointAbsolute Swing Low / HighLive Confirmation Bar CloseLook-Ahead BiasHigh (Repaints retroactively)Zero (Bar-by-bar real-time)
Measured Move SizeFull Peak-to-Trough SwingRemaining Tradeable PortionSlippage & LagIgnored (Assumes 0 lag)Measured directly as Lag CostPractical UtilityChart visual aid onlyValid for Live Trading & Automation
Slide 5: The On-Chart Live Analytics Table
Instant Statistical Breakdown at a Glance
The script features a dynamic, real-time statistical dashboard fixed to the upper-right corner of your chart:
Count: Total confirmed swing legs evaluated across your custom date range.
Average Move: Compares peak-to-trough returns against actual captured returns.
Max / Min Move: Evaluates extreme market swings vs. actual real-time outcomes.
Total Cumulative Return: Demonstrates the cumulative difference between perfection and live execution.
Interactive Tooltips: Hovering over any cell reveals underlying math formulas and metric definitions.
Slide 6: Key Benefits & Strategic Use Cases
Parameter Optimization: Tune your ZigZag depth/period by finding the lowest Lag Cost without increasing false signals.
Realistic Backtesting: Feed realistic confirmation entry prices directly into strategy engines for accurate win rates.
Better Risk Management: Account for the "confirmation gap" between entry price and the swing pivot stop-loss.
FOR EDUCATIONAL USE ONLY....
NOT FINANCIAL ADVICE
Open-source Skript
Ganz im Sinne von TradingView hat dieser Autor sein/ihr Script als Open-Source veröffentlicht. Auf diese Weise können nun auch andere Trader das Script rezensieren und die Funktionalität überprüfen. Vielen Dank an den Autor! Sie können das Script kostenlos verwenden, aber eine Wiederveröffentlichung des Codes unterliegt unseren Hausregeln.

Haftungsausschluss
Die Informationen und Veröffentlichungen sind nicht als Finanz-, Anlage-, Handels- oder andere Arten von Ratschlägen oder Empfehlungen gedacht, die von TradingView bereitgestellt oder gebilligt werden, und stellen diese nicht dar. Lesen Sie mehr in den Nutzungsbedingungen.
Open-source Skript
Ganz im Sinne von TradingView hat dieser Autor sein/ihr Script als Open-Source veröffentlicht. Auf diese Weise können nun auch andere Trader das Script rezensieren und die Funktionalität überprüfen. Vielen Dank an den Autor! Sie können das Script kostenlos verwenden, aber eine Wiederveröffentlichung des Codes unterliegt unseren Hausregeln.
Haftungsausschluss
Die Informationen und Veröffentlichungen sind nicht als Finanz-, Anlage-, Handels- oder andere Arten von Ratschlägen oder Empfehlungen gedacht, die von TradingView bereitgestellt oder gebilligt werden, und stellen diese nicht dar. Lesen Sie mehr in den Nutzungsbedingungen.