OPEN-SOURCE SCRIPT
NSE Sector Wheel - Donut
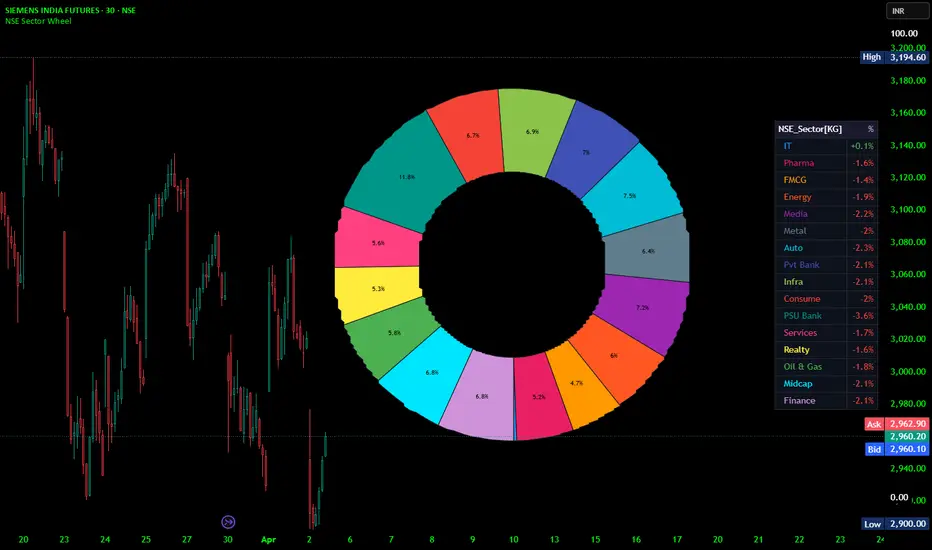
This script generates a donut‑style wheel chart overlaid on a price chart. Its purpose is to visually compare the relative price movements of 16 major NSE (National Stock Exchange of India) sector indices. The size of each donut slice represents the absolute percentage change of that sector over a selected intraday timeframe (relative to the previous day’s close). A legend table next to the donut shows the sector names and the signed percentage change (green for positive, red for negative). The chart is static – it appears fixed on the screen, anchored to the last bar, and does not scroll with the price chart.
User Inputs:
The script provides two adjustable inputs:
Timeframe – The intra‑period used to fetch the current closing price for each sector (e.g., “3” for 3 minutes, “60” for 1 hour). The previous day’s close is always taken from the daily timeframe.
Horizontal Offset – A number of bars (default 60) that shifts the donut chart horizontally to the right from the last bar. This prevents the wheel from overlapping with price action.
Data Sources – NSE Sector Indices
The script tracks the following 16 sector indices (represented by their TradingView symbols):
IT (CNXIT)
Pharma (CNXPHARMA)
FMCG (CNXFMCG)
Energy (CNXENERGY)
Media (CNXMEDIA)
Metal (CNXMETAL)
Auto (CNXAUTO)
Private Bank (NIFTYPVTBANK)
Infrastructure (CNXINFRA)
Consumption (CNXCONSUMPTION)
PSU Bank (CNXPSUBANK)
Services (CNXSERVICE)
Realty (CNXREALTY)
Oil & Gas (NIFTY_OIL_AND_GAS)
Midcap (CNXMIDCAP)
Finance (CNXFINANCE)
Calculations:-
For every sector, the script performs two distinct calculations using the chosen intraday timeframe and the daily previous close:
Absolute percentage change – The absolute value of the percent difference between the current intraday close and the previous day’s close. This value determines the angular size (weight) of the slice in the donut chart. It is always non‑negative.
Signed percentage change – The actual percent difference (can be positive or negative). This is used only for display in the legend table, where positive changes appear in green with a “+” sign and negative changes in red.
The script sums all 16 absolute percentage changes to obtain a total movement value. Each sector’s slice angle is then computed as:
slice angle = (sector’s absolute change / total movement) × 360°
If the total movement is zero (no change in any sector), all slices receive an equal share of 22.5° (360° / 16).
Donut Chart Rendering
The donut chart is drawn only on the last bar of the chart (the most recent completed bar). On each new bar, the previous frame’s polylines and labels are deleted and redrawn from scratch.
Fixed Position:
The wheel is placed at a fixed chart coordinate that does not move when the user scrolls left or right:
Center X = last bar index + horizontal offset
Center Y = 50 (fixed vertical position, using the chart’s percentage scale from 0 to 100)
Inner radius = 20 units
Outer radius = 38 units
Because the Y‑axis is artificially fixed by two invisible plotted lines at 0 and 100, the donut remains at the same vertical position regardless of price levels.
Drawing the Slices>>>>>>>>>>
Each slice is drawn as a filled polygonal arc:
The script calculates the starting angle and ending angle for the slice based on the cumulative sum of previous slice angles.
It then generates a series of points along the outer radius (from start to end) and back along the inner radius (from end to start), forming a closed shape.
The slice is filled with a predefined, distinct colour (e.g., blue for IT, pink for Pharma, orange for FMCG, etc.).
A thin dark outline separates adjacent slices.
Percentage Labels Inside Slices>>>>>>>>>>
If a slice’s angular span is 14 degrees or larger, the script places a centered label inside the slice. The label shows the slice’s percentage of the total absolute movement (rounded to one decimal, e.g., “12.3%”). The label background is transparent, and the text is black. The position is calculated using the midpoint angle of the slice and the average of the inner and outer radii.
Legend Table>>>>>>>>>>>
To the right of the donut chart (positioned in the middle‑right of the chart window), the script draws a two‑column table with 17 rows (header + 16 sectors).
Column 1 – Sector name, colored with the same colour as the corresponding donut slice.
Column 2 – Signed percentage change, formatted to one decimal with a “+” sign for positive values. The text colour is green for gains and red for losses.
The table has a dark background, a subtle frame, and uses a normal font size. The header row displays “NSE_Sector[KG]” and “%”.
Execution Flow >>>>>>>>>>>>
On every bar, the script fetches the previous day’s close for all 16 sectors (once per bar, from the daily timeframe).
It then fetches the current close for each sector using the user‑selected intraday timeframe.
It computes both absolute and signed percentage changes.It calculates the total absolute change and the angular span for each sector.
Only on the last bar:
It clears any previously drawn donut slices and labels.
It draws each slice as a filled arc, from the starting angle to the ending angle.
For slices wide enough, it adds a percentage label.
It builds or updates the legend table with the latest signed changes.
The donut chart remains visible at the same screen location until a new bar forms, at which point it is redrawn with updated data.
Practical Use:
Traders and investors can quickly see which NSE sectors are moving the most (in absolute terms) during the selected intraday period – the larger the slice, the greater the movement regardless of direction. The legend table then reveals whether that movement was positive or negative. This helps identify sector rotation, emerging strength or weakness, and relative volatility among Indian equity sectors.
Disclaimer:
This description is provided for educational and informational purposes only. The script described is a technical analysis tool for the Trading View platform. It does not constitute financial advice, trading recommendations, or investment guidance. Past performance and sector movements do not guarantee future results. Users should conduct their own research and consult with qualified financial advisors before making any trading decisions.
User Inputs:
The script provides two adjustable inputs:
Timeframe – The intra‑period used to fetch the current closing price for each sector (e.g., “3” for 3 minutes, “60” for 1 hour). The previous day’s close is always taken from the daily timeframe.
Horizontal Offset – A number of bars (default 60) that shifts the donut chart horizontally to the right from the last bar. This prevents the wheel from overlapping with price action.
Data Sources – NSE Sector Indices
The script tracks the following 16 sector indices (represented by their TradingView symbols):
IT (CNXIT)
Pharma (CNXPHARMA)
FMCG (CNXFMCG)
Energy (CNXENERGY)
Media (CNXMEDIA)
Metal (CNXMETAL)
Auto (CNXAUTO)
Private Bank (NIFTYPVTBANK)
Infrastructure (CNXINFRA)
Consumption (CNXCONSUMPTION)
PSU Bank (CNXPSUBANK)
Services (CNXSERVICE)
Realty (CNXREALTY)
Oil & Gas (NIFTY_OIL_AND_GAS)
Midcap (CNXMIDCAP)
Finance (CNXFINANCE)
Calculations:-
For every sector, the script performs two distinct calculations using the chosen intraday timeframe and the daily previous close:
Absolute percentage change – The absolute value of the percent difference between the current intraday close and the previous day’s close. This value determines the angular size (weight) of the slice in the donut chart. It is always non‑negative.
Signed percentage change – The actual percent difference (can be positive or negative). This is used only for display in the legend table, where positive changes appear in green with a “+” sign and negative changes in red.
The script sums all 16 absolute percentage changes to obtain a total movement value. Each sector’s slice angle is then computed as:
slice angle = (sector’s absolute change / total movement) × 360°
If the total movement is zero (no change in any sector), all slices receive an equal share of 22.5° (360° / 16).
Donut Chart Rendering
The donut chart is drawn only on the last bar of the chart (the most recent completed bar). On each new bar, the previous frame’s polylines and labels are deleted and redrawn from scratch.
Fixed Position:
The wheel is placed at a fixed chart coordinate that does not move when the user scrolls left or right:
Center X = last bar index + horizontal offset
Center Y = 50 (fixed vertical position, using the chart’s percentage scale from 0 to 100)
Inner radius = 20 units
Outer radius = 38 units
Because the Y‑axis is artificially fixed by two invisible plotted lines at 0 and 100, the donut remains at the same vertical position regardless of price levels.
Drawing the Slices>>>>>>>>>>
Each slice is drawn as a filled polygonal arc:
The script calculates the starting angle and ending angle for the slice based on the cumulative sum of previous slice angles.
It then generates a series of points along the outer radius (from start to end) and back along the inner radius (from end to start), forming a closed shape.
The slice is filled with a predefined, distinct colour (e.g., blue for IT, pink for Pharma, orange for FMCG, etc.).
A thin dark outline separates adjacent slices.
Percentage Labels Inside Slices>>>>>>>>>>
If a slice’s angular span is 14 degrees or larger, the script places a centered label inside the slice. The label shows the slice’s percentage of the total absolute movement (rounded to one decimal, e.g., “12.3%”). The label background is transparent, and the text is black. The position is calculated using the midpoint angle of the slice and the average of the inner and outer radii.
Legend Table>>>>>>>>>>>
To the right of the donut chart (positioned in the middle‑right of the chart window), the script draws a two‑column table with 17 rows (header + 16 sectors).
Column 1 – Sector name, colored with the same colour as the corresponding donut slice.
Column 2 – Signed percentage change, formatted to one decimal with a “+” sign for positive values. The text colour is green for gains and red for losses.
The table has a dark background, a subtle frame, and uses a normal font size. The header row displays “NSE_Sector[KG]” and “%”.
Execution Flow >>>>>>>>>>>>
On every bar, the script fetches the previous day’s close for all 16 sectors (once per bar, from the daily timeframe).
It then fetches the current close for each sector using the user‑selected intraday timeframe.
It computes both absolute and signed percentage changes.It calculates the total absolute change and the angular span for each sector.
Only on the last bar:
It clears any previously drawn donut slices and labels.
It draws each slice as a filled arc, from the starting angle to the ending angle.
For slices wide enough, it adds a percentage label.
It builds or updates the legend table with the latest signed changes.
The donut chart remains visible at the same screen location until a new bar forms, at which point it is redrawn with updated data.
Practical Use:
Traders and investors can quickly see which NSE sectors are moving the most (in absolute terms) during the selected intraday period – the larger the slice, the greater the movement regardless of direction. The legend table then reveals whether that movement was positive or negative. This helps identify sector rotation, emerging strength or weakness, and relative volatility among Indian equity sectors.
Disclaimer:
This description is provided for educational and informational purposes only. The script described is a technical analysis tool for the Trading View platform. It does not constitute financial advice, trading recommendations, or investment guidance. Past performance and sector movements do not guarantee future results. Users should conduct their own research and consult with qualified financial advisors before making any trading decisions.
Open-source Skript
Ganz im Sinne von TradingView hat dieser Autor sein/ihr Script als Open-Source veröffentlicht. Auf diese Weise können nun auch andere Trader das Script rezensieren und die Funktionalität überprüfen. Vielen Dank an den Autor! Sie können das Script kostenlos verwenden, aber eine Wiederveröffentlichung des Codes unterliegt unseren Hausregeln.

Haftungsausschluss
Die Informationen und Veröffentlichungen sind nicht als Finanz-, Anlage-, Handels- oder andere Arten von Ratschlägen oder Empfehlungen gedacht, die von TradingView bereitgestellt oder gebilligt werden, und stellen diese nicht dar. Lesen Sie mehr in den Nutzungsbedingungen.
Open-source Skript
Ganz im Sinne von TradingView hat dieser Autor sein/ihr Script als Open-Source veröffentlicht. Auf diese Weise können nun auch andere Trader das Script rezensieren und die Funktionalität überprüfen. Vielen Dank an den Autor! Sie können das Script kostenlos verwenden, aber eine Wiederveröffentlichung des Codes unterliegt unseren Hausregeln.
Haftungsausschluss
Die Informationen und Veröffentlichungen sind nicht als Finanz-, Anlage-, Handels- oder andere Arten von Ratschlägen oder Empfehlungen gedacht, die von TradingView bereitgestellt oder gebilligt werden, und stellen diese nicht dar. Lesen Sie mehr in den Nutzungsbedingungen.