OPEN-SOURCE SCRIPT
[blackcat] L1 Mid-Axis Indicator
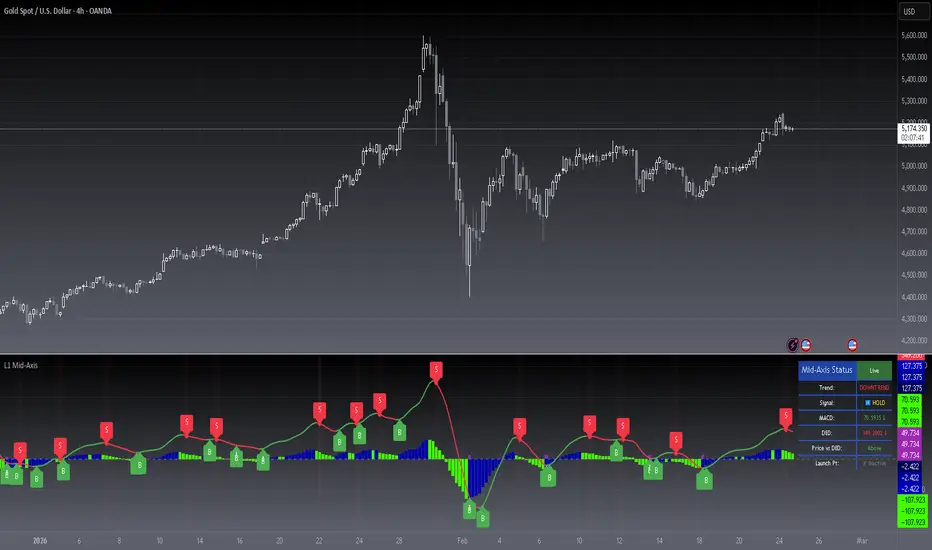
█ OVERVIEW
The L1 Mid-Axis Indicator is a sophisticated momentum-based oscillator that combines enhanced MACD calculations with a proprietary DED line to identify trend launch points, buy signals, and sell opportunities. This indicator utilizes a unique dual-signal approach, detecting launch points when MACD is below zero but rising for consecutive periods, while the DED line provides dynamic support/resistance levels for precise entry and exit timing.
█ CONCEPTS
This indicator builds upon the traditional MACD framework with significant enhancements to improve signal accuracy and reduce false positives.
Core Principles
• Launch Point Detection: Identifies potential trend starts when MACD is below zero but increasing for 4 consecutive periods, indicating momentum buildup
• DED Line (Dynamic Equilibrium Direction): A proprietary smoothed line derived from the DIK value (4×DIF - 3×DEA) using ALMA filtering, serving as dynamic support/resistance
• Dual-Signal Confirmation: Buy signals require close price crossing above DED, while sell signals trigger when DED changes from rising (green) to falling (red)
• Multi-Layer Visualization: Uses layered histogram rendering with depth effects for clear trend state identification
Technical Foundation
• DIF (Difference): Fast EMA (9) minus Slow EMA (150) - measures short-term vs long-term momentum
• DEA (Difference Exponential Average): Signal line - 12-period EMA of DIF
• DIK (Dynamic Indicator K): 4×DIF - 3×DEA - enhanced momentum component
• DED (Dynamic Equilibrium Direction): ALMA-smoothed DIK - the core signal line
█ HOW TO USE
1 — Add to Chart
• Open TradingView and navigate to the Indicators panel
• Search for "[blackcat] L1 Mid-Axis Indicator"
• Add to your chart as a separate pane (overlay=false)
2 — Understand Visual Elements
• Purple Histogram: Launch points - potential trend start zones
• Blue Histogram: Uptrend or Rebound - bullish momentum
• Green Histogram: Downtrend or Continuing Down - bearish momentum
• DED Line: Green when rising, Red when falling - dynamic support/resistance
• B Labels: Buy signals at confirmed launch points
• S Labels: Sell signals at DED reversals
3 — Signal Interpretation
• Launch Point (🚀): MACD < 0 and rising for 4+ bars - watch for trend reversal
• Buy Signal (📈): Close crosses above DED or Launch Point with price confirmation
• Sell Signal (📉): DED changes from green to red (trend reversal)
• Hold Position (⏸️): Maintain current position when no clear signal
Input Parameters
• Fast EMA Period: Default 9 - Controls short-term momentum sensitivity (1-500)
• Slow EMA Period: Default 150 - Controls long-term trend reference (1-500)
• Signal Period: Default 12 - Signal line smoothing period (1-500)
• Show Status Table: Display real-time indicator status panel
• Show Buy/Sell Labels: Display B/S labels on chart
• Show Launch Arrow: Display arrow at launch points
• Highlight Signal Bars: Subtle background highlighting at signal bars
• Show Signals: Enable/disable signal labels
• Show DED Line: Display the Dynamic Equilibrium Direction line
█ SIGNALS
Visual Elements
• Purple Histogram: Launch Point - indicates potential trend start when MACD is below zero but rising consecutively
• Blue Histogram: Uptrend (MACD > 0 and rising) or Rebound (MACD < 0 but rising) - bullish momentum
• Green Histogram: Downtrend (MACD > 0 but falling) or Continuing Down (MACD < 0 and falling) - bearish momentum
• DED Line: Green when rising (support), Red when falling (resistance) - key reference level
• B Label: Buy signal at launch point with price confirmation or close crossing above DED
• S Label: Sell signal when DED changes from rising to falling (3 consecutive decreases)
• Launch Arrow (↑): Indicates launch point detection
Alert Conditions
• 🚀 Launch Point Alert: Triggers when MACD launch point is detected
• 📈 Primary Buy Alert: Triggers when close price crosses above DED line
• 📉 Primary Sell Alert: Triggers when DED changes from green to red
• 💎 Buy Alert: Triggers at launch point with additional confirmation
• ⚠️ Sell Alert: Triggers on strong DED downtrend (3 consecutive decreases)
█ STATUS TABLE
The real-time status table displays:
• Trend: Current market state (UPTREND, DOWNTREND, REBOUND, CONTINUING DOWN, NEUTRAL)
• Signal: Current signal status (🚀 LAUNCH, 📈 BUY, 📉 SELL, ⏸️ HOLD)
• MACD: Current MACD value with direction arrow (↑/↓/→)
• DED: Current DED value with direction arrow (↑/↓/→)
• Price vs DED: Relationship between close price and DED line (Above/Below/Equal)
• Launch Pt: Active launch point status (✓ Active/✗ Inactive)
█ FEATURES
• Enhanced MACD Algorithm: Custom DIF/DEA/DIK/DED calculations for improved signal accuracy
• Launch Point Detection: Identifies potential trend starts before they become obvious
• Dynamic Support/Resistance: DED line adapts to market conditions in real-time
• Multi-Layer Histograms: Depth-effect visualization for clear trend state identification
• Real-Time Status Panel: Comprehensive table showing all key indicator values
• Multiple Alert Types: Five different alert conditions for various trading scenarios
• Customizable Display: Toggle various visual elements based on preference
• No Repainting: All signals are based on confirmed historical data
█ LIMITATIONS
• Lagging Indicator: Based on moving averages, signals may lag behind rapid price movements
• Sideways Markets: May generate false signals during choppy or range-bound conditions
• Parameter Sensitivity: Default parameters work well for most markets but may need adjustment for specific instruments
• Not a Standalone System: Should be used in conjunction with other analysis methods and risk management
• Historical Performance: Past signals do not guarantee future results
█ NOTES
• Recommended Timeframes: Works best on 4H, Daily, and Weekly timeframes for swing trading
• Market Types: Suitable for trending markets; use caution in ranging markets
• Best Practices: Wait for confirmation signals and use proper position sizing
• Combination Strategies: Combine with support/resistance levels, volume analysis, or other indicators for improved accuracy
• Backtesting: Always backtest on historical data before live trading
• Risk Management: Never risk more than 1-2% of your account per trade
═════════════════════════════════════════════════════════════════════════
DISCLAIMER
This indicator is provided for educational and informational purposes only. Past performance does not guarantee future results. Trading involves substantial risk of loss and is not suitable for every investor. Always conduct your own research and consult with a qualified financial advisor before making trading decisions.
For questions or feedback, use the comments section below.
The L1 Mid-Axis Indicator is a sophisticated momentum-based oscillator that combines enhanced MACD calculations with a proprietary DED line to identify trend launch points, buy signals, and sell opportunities. This indicator utilizes a unique dual-signal approach, detecting launch points when MACD is below zero but rising for consecutive periods, while the DED line provides dynamic support/resistance levels for precise entry and exit timing.
█ CONCEPTS
This indicator builds upon the traditional MACD framework with significant enhancements to improve signal accuracy and reduce false positives.
Core Principles
• Launch Point Detection: Identifies potential trend starts when MACD is below zero but increasing for 4 consecutive periods, indicating momentum buildup
• DED Line (Dynamic Equilibrium Direction): A proprietary smoothed line derived from the DIK value (4×DIF - 3×DEA) using ALMA filtering, serving as dynamic support/resistance
• Dual-Signal Confirmation: Buy signals require close price crossing above DED, while sell signals trigger when DED changes from rising (green) to falling (red)
• Multi-Layer Visualization: Uses layered histogram rendering with depth effects for clear trend state identification
Technical Foundation
• DIF (Difference): Fast EMA (9) minus Slow EMA (150) - measures short-term vs long-term momentum
• DEA (Difference Exponential Average): Signal line - 12-period EMA of DIF
• DIK (Dynamic Indicator K): 4×DIF - 3×DEA - enhanced momentum component
• DED (Dynamic Equilibrium Direction): ALMA-smoothed DIK - the core signal line
█ HOW TO USE
1 — Add to Chart
• Open TradingView and navigate to the Indicators panel
• Search for "[blackcat] L1 Mid-Axis Indicator"
• Add to your chart as a separate pane (overlay=false)
2 — Understand Visual Elements
• Purple Histogram: Launch points - potential trend start zones
• Blue Histogram: Uptrend or Rebound - bullish momentum
• Green Histogram: Downtrend or Continuing Down - bearish momentum
• DED Line: Green when rising, Red when falling - dynamic support/resistance
• B Labels: Buy signals at confirmed launch points
• S Labels: Sell signals at DED reversals
3 — Signal Interpretation
• Launch Point (🚀): MACD < 0 and rising for 4+ bars - watch for trend reversal
• Buy Signal (📈): Close crosses above DED or Launch Point with price confirmation
• Sell Signal (📉): DED changes from green to red (trend reversal)
• Hold Position (⏸️): Maintain current position when no clear signal
Input Parameters
• Fast EMA Period: Default 9 - Controls short-term momentum sensitivity (1-500)
• Slow EMA Period: Default 150 - Controls long-term trend reference (1-500)
• Signal Period: Default 12 - Signal line smoothing period (1-500)
• Show Status Table: Display real-time indicator status panel
• Show Buy/Sell Labels: Display B/S labels on chart
• Show Launch Arrow: Display arrow at launch points
• Highlight Signal Bars: Subtle background highlighting at signal bars
• Show Signals: Enable/disable signal labels
• Show DED Line: Display the Dynamic Equilibrium Direction line
█ SIGNALS
Visual Elements
• Purple Histogram: Launch Point - indicates potential trend start when MACD is below zero but rising consecutively
• Blue Histogram: Uptrend (MACD > 0 and rising) or Rebound (MACD < 0 but rising) - bullish momentum
• Green Histogram: Downtrend (MACD > 0 but falling) or Continuing Down (MACD < 0 and falling) - bearish momentum
• DED Line: Green when rising (support), Red when falling (resistance) - key reference level
• B Label: Buy signal at launch point with price confirmation or close crossing above DED
• S Label: Sell signal when DED changes from rising to falling (3 consecutive decreases)
• Launch Arrow (↑): Indicates launch point detection
Alert Conditions
• 🚀 Launch Point Alert: Triggers when MACD launch point is detected
• 📈 Primary Buy Alert: Triggers when close price crosses above DED line
• 📉 Primary Sell Alert: Triggers when DED changes from green to red
• 💎 Buy Alert: Triggers at launch point with additional confirmation
• ⚠️ Sell Alert: Triggers on strong DED downtrend (3 consecutive decreases)
█ STATUS TABLE
The real-time status table displays:
• Trend: Current market state (UPTREND, DOWNTREND, REBOUND, CONTINUING DOWN, NEUTRAL)
• Signal: Current signal status (🚀 LAUNCH, 📈 BUY, 📉 SELL, ⏸️ HOLD)
• MACD: Current MACD value with direction arrow (↑/↓/→)
• DED: Current DED value with direction arrow (↑/↓/→)
• Price vs DED: Relationship between close price and DED line (Above/Below/Equal)
• Launch Pt: Active launch point status (✓ Active/✗ Inactive)
█ FEATURES
• Enhanced MACD Algorithm: Custom DIF/DEA/DIK/DED calculations for improved signal accuracy
• Launch Point Detection: Identifies potential trend starts before they become obvious
• Dynamic Support/Resistance: DED line adapts to market conditions in real-time
• Multi-Layer Histograms: Depth-effect visualization for clear trend state identification
• Real-Time Status Panel: Comprehensive table showing all key indicator values
• Multiple Alert Types: Five different alert conditions for various trading scenarios
• Customizable Display: Toggle various visual elements based on preference
• No Repainting: All signals are based on confirmed historical data
█ LIMITATIONS
• Lagging Indicator: Based on moving averages, signals may lag behind rapid price movements
• Sideways Markets: May generate false signals during choppy or range-bound conditions
• Parameter Sensitivity: Default parameters work well for most markets but may need adjustment for specific instruments
• Not a Standalone System: Should be used in conjunction with other analysis methods and risk management
• Historical Performance: Past signals do not guarantee future results
█ NOTES
• Recommended Timeframes: Works best on 4H, Daily, and Weekly timeframes for swing trading
• Market Types: Suitable for trending markets; use caution in ranging markets
• Best Practices: Wait for confirmation signals and use proper position sizing
• Combination Strategies: Combine with support/resistance levels, volume analysis, or other indicators for improved accuracy
• Backtesting: Always backtest on historical data before live trading
• Risk Management: Never risk more than 1-2% of your account per trade
═════════════════════════════════════════════════════════════════════════
DISCLAIMER
This indicator is provided for educational and informational purposes only. Past performance does not guarantee future results. Trading involves substantial risk of loss and is not suitable for every investor. Always conduct your own research and consult with a qualified financial advisor before making trading decisions.
For questions or feedback, use the comments section below.
Open-source Skript
Ganz im Sinne von TradingView hat dieser Autor sein/ihr Script als Open-Source veröffentlicht. Auf diese Weise können nun auch andere Trader das Script rezensieren und die Funktionalität überprüfen. Vielen Dank an den Autor! Sie können das Script kostenlos verwenden, aber eine Wiederveröffentlichung des Codes unterliegt unseren Hausregeln.

Avoid losing contact!Don't miss out! The first and most important thing to do is to join my Discord chat now! Click here to start your adventure: discord.com/invite/ZTGpQJq 防止失联,请立即行动,加入本猫聊天群: discord.com/invite/ZTGpQJq
Haftungsausschluss
Die Informationen und Veröffentlichungen sind nicht als Finanz-, Anlage-, Handels- oder andere Arten von Ratschlägen oder Empfehlungen gedacht, die von TradingView bereitgestellt oder gebilligt werden, und stellen diese nicht dar. Lesen Sie mehr in den Nutzungsbedingungen.
Open-source Skript
Ganz im Sinne von TradingView hat dieser Autor sein/ihr Script als Open-Source veröffentlicht. Auf diese Weise können nun auch andere Trader das Script rezensieren und die Funktionalität überprüfen. Vielen Dank an den Autor! Sie können das Script kostenlos verwenden, aber eine Wiederveröffentlichung des Codes unterliegt unseren Hausregeln.
Avoid losing contact!Don't miss out! The first and most important thing to do is to join my Discord chat now! Click here to start your adventure: discord.com/invite/ZTGpQJq 防止失联,请立即行动,加入本猫聊天群: discord.com/invite/ZTGpQJq
Haftungsausschluss
Die Informationen und Veröffentlichungen sind nicht als Finanz-, Anlage-, Handels- oder andere Arten von Ratschlägen oder Empfehlungen gedacht, die von TradingView bereitgestellt oder gebilligt werden, und stellen diese nicht dar. Lesen Sie mehr in den Nutzungsbedingungen.