US CPI & PPI Release Dates
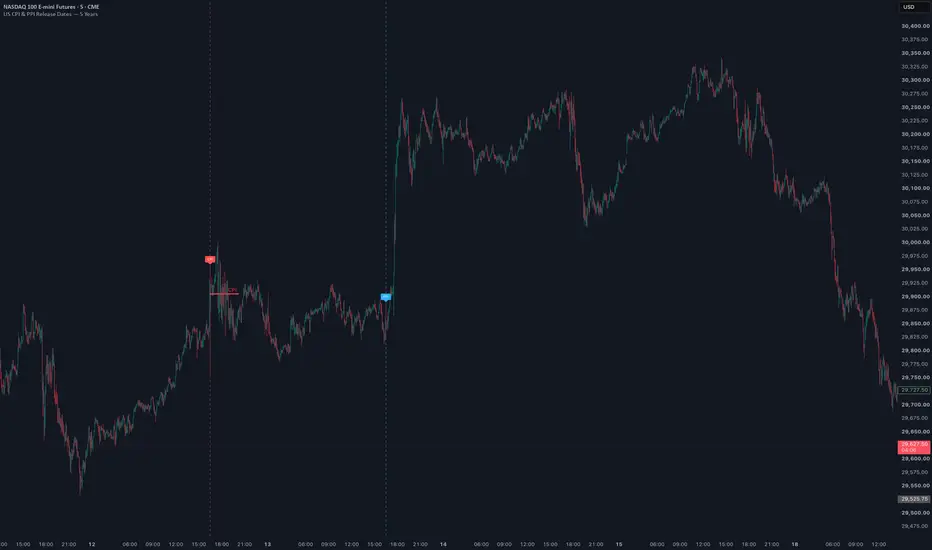
This indicator marks historical US Consumer Price Index (CPI) and Producer Price Index (PPI) release dates directly on the chart.
It includes five years of official release dates from the US Bureau of Labor Statistics. Each release is marked at 8:30 a.m. New York time, with daylight-saving changes handled automatically.
Features:
• Separate vertical markers for CPI and PPI
• CPI and PPI can be enabled or disabled independently
• Optional event labels
• Custom colours, line styles and line widths
• Works on intraday and higher-timeframe charts
CPI is shown in red and PPI in blue by default.
The release dates are embedded in the script because Pine Script cannot access TradingView’s economic calendar directly.
It includes five years of official release dates from the US Bureau of Labor Statistics. Each release is marked at 8:30 a.m. New York time, with daylight-saving changes handled automatically.
Features:
• Separate vertical markers for CPI and PPI
• CPI and PPI can be enabled or disabled independently
• Optional event labels
• Custom colours, line styles and line widths
• Works on intraday and higher-timeframe charts
CPI is shown in red and PPI in blue by default.
The release dates are embedded in the script because Pine Script cannot access TradingView’s economic calendar directly.

Haftungsausschluss
Die Informationen und Veröffentlichungen sind nicht als Finanz-, Anlage-, Handels- oder andere Arten von Ratschlägen oder Empfehlungen gedacht, die von TradingView bereitgestellt oder gebilligt werden, und stellen diese nicht dar. Lesen Sie mehr in den Nutzungsbedingungen.
Haftungsausschluss
Die Informationen und Veröffentlichungen sind nicht als Finanz-, Anlage-, Handels- oder andere Arten von Ratschlägen oder Empfehlungen gedacht, die von TradingView bereitgestellt oder gebilligt werden, und stellen diese nicht dar. Lesen Sie mehr in den Nutzungsbedingungen.