OPEN-SOURCE SCRIPT
Aktualisiert RSI Return Study
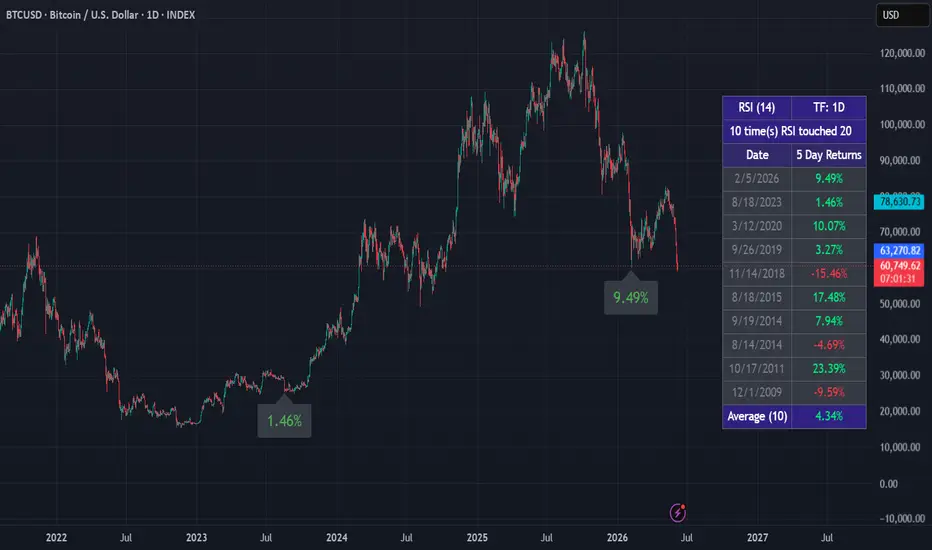
Ever wonder what happens after the RSI hits an extreme level on your favorite ticker? This indicator answers that question historically.
What it does:
How to use:
Notes:
What it does:
- Finds every instance where the RSI crossed a user-defined trigger level
- Measures the forward price return N trading days later
- Displays each signal date and return in a clean table
- Plots labels on the chart at each signal location
- Shows the average return across all historical signals
How to use:
- Set "When RSI Touches..." to your oversold level (e.g. 25) or overbought level (e.g. 75)
- Set "Calculate Return Days Later" to how many trading days forward you want to measure
- Works on any timeframe — bar count is automatically calculated for you
- Adjust "Max Results/Labels to Display" to control how much shows on the chart
Notes:
- All signals are included in the average regardless of the display limit
- Set "Min Bars Between Signals" to 0 to count every RSI cross, or increase it to reduce clustering during volatile periods
Versionshinweise
Added the ability to see more than one forward return. For example, can now input"1D,3D,7D" or
"5D,1M,3M,6M,1Y"
Can support up to 5 forward returns.
Open-source Skript
Ganz im Sinne von TradingView hat dieser Autor sein/ihr Script als Open-Source veröffentlicht. Auf diese Weise können nun auch andere Trader das Script rezensieren und die Funktionalität überprüfen. Vielen Dank an den Autor! Sie können das Script kostenlos verwenden, aber eine Wiederveröffentlichung des Codes unterliegt unseren Hausregeln.

Haftungsausschluss
Die Informationen und Veröffentlichungen sind nicht als Finanz-, Anlage-, Handels- oder andere Arten von Ratschlägen oder Empfehlungen gedacht, die von TradingView bereitgestellt oder gebilligt werden, und stellen diese nicht dar. Lesen Sie mehr in den Nutzungsbedingungen.
Open-source Skript
Ganz im Sinne von TradingView hat dieser Autor sein/ihr Script als Open-Source veröffentlicht. Auf diese Weise können nun auch andere Trader das Script rezensieren und die Funktionalität überprüfen. Vielen Dank an den Autor! Sie können das Script kostenlos verwenden, aber eine Wiederveröffentlichung des Codes unterliegt unseren Hausregeln.
Haftungsausschluss
Die Informationen und Veröffentlichungen sind nicht als Finanz-, Anlage-, Handels- oder andere Arten von Ratschlägen oder Empfehlungen gedacht, die von TradingView bereitgestellt oder gebilligt werden, und stellen diese nicht dar. Lesen Sie mehr in den Nutzungsbedingungen.