Aktualisiert
[blackcat] L1 Mel Widner Rainbow Oscillator
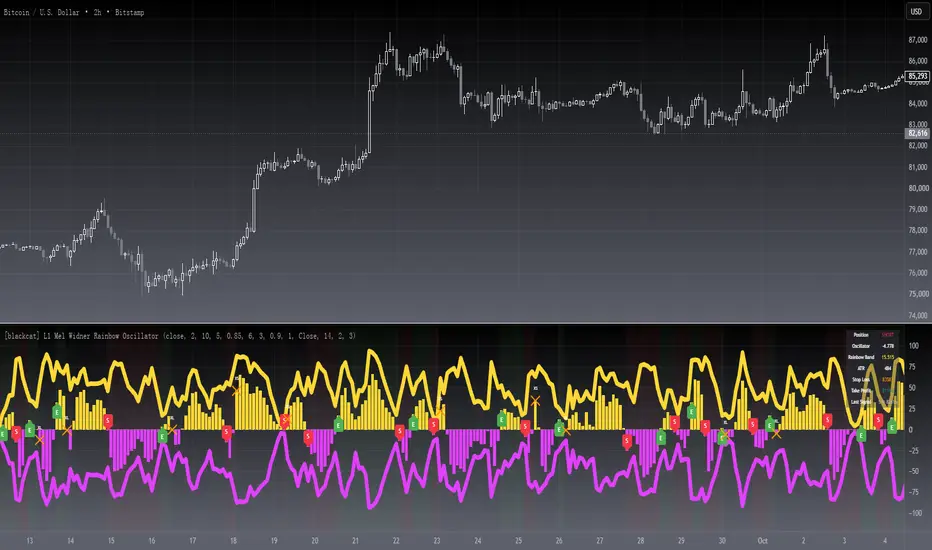
NOTE: Because the originally released script failed to comply with the House Rule in the description, it was banned. After revising and reviewing the description, it is republished again. Please forgive the inconvenience caused.
Level: 1
Background
Mel Widner developed the Rainbow Oscillator and published it in 1997 in the Technical Analysis of Stocks and Commodities magazine.
Function
Mel Widner Rainbow Oscillator helps to predict the changes in the market trend and to follow trends. The oscillator is derived from a consensus of trends that, when plotted in color, has the appearance of a rainbow. It offers only two possible states, the upward and the downward. The Rainbow Oscillator is based on the Rainbow charts trend and is just like the Rainbow Moving Average charts. It works on the basis of a two-period moving average and its graph also helps to identify the highest high value and the lowest low value among moving averages. The Rainbow Oscillator is a simple indicator used to forecast trend reversal. It is a simple yet very important technical analysis tool. The oscillator works on the same rules as does the Rainbow indicator. It uses two simple moving averages, HHV and LLV. The Rainbow Oscillator creates an oscillator with bandwidth lines. Although it is a relatively new indicator but has become very popular for effectively forecasting the changes in the trend direction. The Rainbow Oscillator appears as a director of the trend as it follows the ups and downs of the market. The growing width of the Rainbow indicates that the current trend is likely to continue. The values of the Rainbow Oscillator beyond 80 suggest an unstable market and prone to a sudden reversal of the current market trend. On the other hand, when the prices move to the Rainbow and the Rainbow Oscillator begins to become flat, it indicates that the market is stable and the bandwidth decreases. The Rainbow Oscillator values falling below 20 again indicate an unstable market and also prone to a sudden reversal of the current trend in the market.
In simple words, we can derive the following rules.
Key Signal
PosNeg --> Rainbow Oscillator Output.
Labels and alerts are added.
Remarks
This is a Level 1 free and open source indicator.
Feedbacks are appreciated.
Level: 1
Background
Mel Widner developed the Rainbow Oscillator and published it in 1997 in the Technical Analysis of Stocks and Commodities magazine.
Function
Mel Widner Rainbow Oscillator helps to predict the changes in the market trend and to follow trends. The oscillator is derived from a consensus of trends that, when plotted in color, has the appearance of a rainbow. It offers only two possible states, the upward and the downward. The Rainbow Oscillator is based on the Rainbow charts trend and is just like the Rainbow Moving Average charts. It works on the basis of a two-period moving average and its graph also helps to identify the highest high value and the lowest low value among moving averages. The Rainbow Oscillator is a simple indicator used to forecast trend reversal. It is a simple yet very important technical analysis tool. The oscillator works on the same rules as does the Rainbow indicator. It uses two simple moving averages, HHV and LLV. The Rainbow Oscillator creates an oscillator with bandwidth lines. Although it is a relatively new indicator but has become very popular for effectively forecasting the changes in the trend direction. The Rainbow Oscillator appears as a director of the trend as it follows the ups and downs of the market. The growing width of the Rainbow indicates that the current trend is likely to continue. The values of the Rainbow Oscillator beyond 80 suggest an unstable market and prone to a sudden reversal of the current market trend. On the other hand, when the prices move to the Rainbow and the Rainbow Oscillator begins to become flat, it indicates that the market is stable and the bandwidth decreases. The Rainbow Oscillator values falling below 20 again indicate an unstable market and also prone to a sudden reversal of the current trend in the market.
In simple words, we can derive the following rules.
- The Rainbow Oscillator’s wider width suggests a continuation of the current trend.
The Rainbow Oscillator between -50 and +50 indicates a stable trend.
When traveling beyond 80, the Rainbow Oscillator suggests an unstable market and a possible reversal of the current trend.
The Rainbow Oscillator traveling below 20 also indicates instability and a potential reversal of the current market trend.
Key Signal
PosNeg --> Rainbow Oscillator Output.
Labels and alerts are added.
Remarks
This is a Level 1 free and open source indicator.
Feedbacks are appreciated.
Versionshinweise
OVERVIEWThe L1 Mel Widner Rainbow Oscillator is a custom indicator designed for TradingView that provides a visual representation of market trends using a unique oscillating pattern. This script calculates and plots two main components: the Rainbow Bands and the Rainbow Oscillator. The Rainbow Bands help identify the upper and lower boundaries of price movements, while the Rainbow Oscillator indicates the momentum and potential reversal points in the market. This tool is particularly useful for traders looking to identify trend reversals and potential entry/exit points.
FEATURES
🌈 Rainbow Bands: Plots the upper and lower boundaries of price movements.
📈 Rainbow Oscillator: Indicates market momentum and potential reversal points.
🔄 Customizable Parameters: Allows users to adjust the price source, smoothing length, and level.
🎯 Buy/Sell Signals: Generates buy and sell signals based on crossover and crossunder conditions.
🔔 Alerts: Provides alerts for long and short conditions.
HOW TO USE
Add the Script: Copy and paste the script into the Pine Editor on TradingView.
Set Parameters:
Price Source: Select the price source (e.g., close, open, high, low).
Smoothing Length: Adjust the smoothing length to control the sensitivity of the indicator.
Level: Set the level to determine the range for calculating the highest and lowest prices.
Interpret the Plots:
Rainbow Bands: Observe the upper and lower bands to understand the price range.
Rainbow Oscillator: Look for crossovers above or below the zero line for buy/sell signals.
Use Alerts: Enable alerts to receive notifications for potential trading opportunities.
LIMITATIONS
The indicator may generate false signals in highly volatile or ranging markets.
Customization of parameters is essential for optimal performance.
Backtesting is recommended to validate the effectiveness of the indicator in different market conditions.
NOTES
The script uses the ALMA (Arnaud Legoux Moving Average) for smoothing the Rainbow Oscillator.
The indicator is designed to work with any timeframe but may require adjustments for different assets.
Always combine this indicator with other analysis tools for more reliable trading decisions.
Versionshinweise
█ OVERVIEWA Pine v6 rebuild of Mel Widner's Rainbow Oscillator: ten stacked simple
moving averages measured against the recent price range, smoothed into a
zero-line momentum oscillator. Version 2 adds a two-sided trading layer:
entries, exits, cooldown, ATR risk levels, optional re-entry, a
dashboard and six alert channels.
█ CONCEPTS
• Rainbow Band: the spread between the fastest and the slowest of ten
stacked SMAs, normalised by the recent price range and scaled to
0-100. Wide bands mean the averages fan out - a well-ordered trend.
• Rainbow Oscillator: the distance between price and the average of
those ten averages, normalised by the same range. It swings around
zero, so a zero cross reads as a momentum flip.
• Signal governance: one position state machine decides who may fire,
so an entry never repeats while a position is open and an exit
outranks an entry on the same bar.
█ HOW TO USE
1 — Add the indicator to any chart. Yellow and fuchsia columns are the
oscillator; thick yellow and fuchsia lines are the Rainbow Bands.
2 — Read the zero line: a green E label marks a long opportunity, a red
S label marks a short one.
3 — Orange XL / XS crosses close the open position - on the reverse zero
cross, or when the oscillator pushes through the band exit level.
4 — Tune Level and Smoothing Length first; keep the defaults for the
classic Widner behaviour.
Input Parameters
• Price Source: series feeding the averages (default close).
• Smoothing Length / Level: SMA period and number of stacked averages
(2 and 10, the classic Widner setting).
• ALMA Smoothing: optional filter on the oscillator, with its own
length, offset and sigma (5 / 0.85 / 6, as in the original).
• Enable Short Signals: turn the sell side off for long-only accounts.
• Same-bar Exclusivity / Cooldown Bars: suppress whipsaw re-triggers
(cooldown 3 bars, 0 disables it).
• Enable Band Exit / Band Exit %: over-extension exit as a fraction of
the Rainbow Band (default 90%).
• Enable Re-entry / Anchor Window / Breakout Source: optional RL / RS
re-entry after an exit (off by default).
• ATR Length / Stop Loss xATR / Take Profit xATR: risk references per
open trade (14, 2.0, 3.0).
• Show Signal Labels / Show Position Background / Show Dashboard.
█ FEATURES
• Two-sided entries and exits from one position state machine
• Cooldown plus same-bar exclusivity to tame choppy whipsaw
• ATR based stop-loss and take-profit references per open trade
• Optional re-entry anchored on the exit bar (RL / RS)
• Position background tint, E / S / XL / XS labels, live dashboard
• Six alertcondition channels plus close-confirmed dynamic alerts
█ SIGNALS
Visual Elements
• E (green, below the line): long entry on an upward zero cross
• S (red, above the line): short entry on a downward zero cross
• XL / XS (orange cross): exit of the open long / short position
• RL / RS (teal / maroon): optional re-entry after an exit
• Background tint: green while long, red while short, none when flat
• Dashboard: position, oscillator value, band width, ATR, stop loss,
take profit, last signal and its price
█ IMPLEMENTATION NOTES
Built from ta.sma stacks, ta.highest / ta.lowest normalisation, ta.alma,
ta.crossover / ta.crossunder and ta.atr. Every ta.* call runs once per
bar, and all alerts use freq_once_per_bar_close: signals confirm at bar
close and never change inside the bar.
█ LIMITATIONS
• Zero-cross oscillators lag - entries arrive after the turn
• Ranging markets still produce whipsaw even with the cooldown on
• Stop loss and take profit are reference levels, not orders
• The bands need about Smoothing Length x Level bars of history to
stabilise; ignore signals in that warm-up zone
• No substitute for position sizing, risk management or your own plan
█ NOTES
• Idea credited to Mel Widner, author of the Rainbow Oscillator and
Rainbow Bands on StockCharts; version 2 adds the trading layer
• Mozilla Public License 2.0 - reuse and modify freely
═════════════════════════════════════════════════════════════════════════
For questions or feedback, use the comments section below.
Not investment advice - you trade your own risk.

Don't miss out! The first and most important thing to do is to join my Discord chat now! Click here to start your adventure: discord.com/invite/ZTGpQJq My new github for more pine development soon: github.com/wxt-coder
Haftungsausschluss
Die Informationen und Veröffentlichungen sind nicht als Finanz-, Anlage-, Handels- oder andere Arten von Ratschlägen oder Empfehlungen gedacht, die von TradingView bereitgestellt oder gebilligt werden, und stellen diese nicht dar. Lesen Sie mehr in den Nutzungsbedingungen.
Don't miss out! The first and most important thing to do is to join my Discord chat now! Click here to start your adventure: discord.com/invite/ZTGpQJq My new github for more pine development soon: github.com/wxt-coder
Haftungsausschluss
Die Informationen und Veröffentlichungen sind nicht als Finanz-, Anlage-, Handels- oder andere Arten von Ratschlägen oder Empfehlungen gedacht, die von TradingView bereitgestellt oder gebilligt werden, und stellen diese nicht dar. Lesen Sie mehr in den Nutzungsbedingungen.