Aktualisiert
SMT Divergence 3-Way + Key Levels, Killzones & Structure
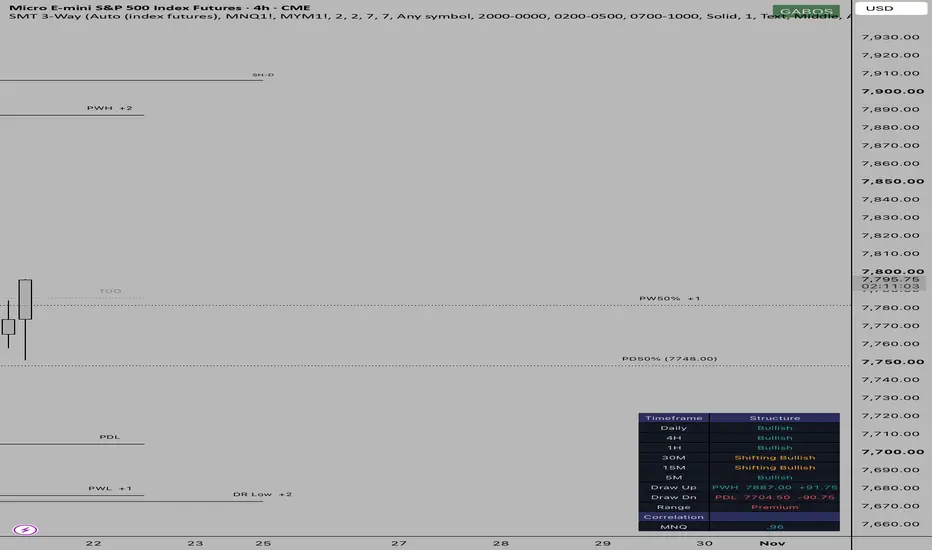
An ICT-oriented toolkit for index futures, built around three-way SMT divergence with the supporting context needed to act on it.
SMT Divergence Compares your chart against the other two legs of the ES/NQ/YM family, resolved automatically and matched micro to micro. On MES you get MNQ and MYM; on MNQ you get MES and MYM. Four divergence types, each independently toggleable:
• Internal SMT on minor swings
• External SMT on major structural swings
• Previous D/W/M candle sweep SMT, where your chart takes a prior period's high or low and a correlate fails to
• Asia/London session SMT on session extremes
Options for requiring one or both correlates to diverge, keeping only the most recent signal per type, and showing provisional divergence while a swing is still forming. On symbols outside the index futures family, SMT switches off rather than comparing unrelated markets.
Correlation health A rolling correlation readout for each comparison leg, color-coded against adjustable thresholds. SMT between decoupled instruments is meaningless, so there is an optional setting to mute signals when both legs fall below a correlation floor.
Key levels Previous day, week and month highs and lows plus their 50% equilibrium, drawn from higher-timeframe data so they appear on every chart timeframe. Lines anchor to the candle that printed the extreme and terminate at the bar that swept them, with equilibrium lines extending independently. Midnight Open and True Day Open included. Full per-tier control of color, style, width, extension and label placement.
Killzones Asia, London, NY AM and NY PM as shaded boxes with session high/low lines. Everything stays contained within the session rather than extending to the right edge.
CISD Change in State of Delivery, anchored to the open of the first candle in the run that delivered the leg. Gated behind a liquidity sweep of a swing pivot or key level, with filters for minimum run length, consecutive closes beyond the level, ATR displacement, sweep-to-signal window, and one signal per sweep.
CHoCH and BOS Swing-based structure breaks with running bias. Breaks against bias are marked CHoCH, breaks with bias are BOS, styled separately. Optional displacement requirement turns a plain structure break into an MSS.
Day separators Day-of-week markers on a flat label row, named from the session close so futures sessions label correctly rather than a day behind.
Alerts are available on every SMT type, CISD and CHoCH.
SMT Divergence Compares your chart against the other two legs of the ES/NQ/YM family, resolved automatically and matched micro to micro. On MES you get MNQ and MYM; on MNQ you get MES and MYM. Four divergence types, each independently toggleable:
• Internal SMT on minor swings
• External SMT on major structural swings
• Previous D/W/M candle sweep SMT, where your chart takes a prior period's high or low and a correlate fails to
• Asia/London session SMT on session extremes
Options for requiring one or both correlates to diverge, keeping only the most recent signal per type, and showing provisional divergence while a swing is still forming. On symbols outside the index futures family, SMT switches off rather than comparing unrelated markets.
Correlation health A rolling correlation readout for each comparison leg, color-coded against adjustable thresholds. SMT between decoupled instruments is meaningless, so there is an optional setting to mute signals when both legs fall below a correlation floor.
Key levels Previous day, week and month highs and lows plus their 50% equilibrium, drawn from higher-timeframe data so they appear on every chart timeframe. Lines anchor to the candle that printed the extreme and terminate at the bar that swept them, with equilibrium lines extending independently. Midnight Open and True Day Open included. Full per-tier control of color, style, width, extension and label placement.
Killzones Asia, London, NY AM and NY PM as shaded boxes with session high/low lines. Everything stays contained within the session rather than extending to the right edge.
CISD Change in State of Delivery, anchored to the open of the first candle in the run that delivered the leg. Gated behind a liquidity sweep of a swing pivot or key level, with filters for minimum run length, consecutive closes beyond the level, ATR displacement, sweep-to-signal window, and one signal per sweep.
CHoCH and BOS Swing-based structure breaks with running bias. Breaks against bias are marked CHoCH, breaks with bias are BOS, styled separately. Optional displacement requirement turns a plain structure break into an MSS.
Day separators Day-of-week markers on a flat label row, named from the session close so futures sessions label correctly rather than a day behind.
Alerts are available on every SMT type, CISD and CHoCH.
Versionshinweise
Updates to script: New features
• CISD detection — change in state of delivery, anchored to the open of the candle run that delivered the leg, gated behind a liquidity sweep. Then heavily filtered after it fired too often: sweep source (pivots and key levels rather than rolling extremes), minimum run length, consecutive closes beyond the level, displacement, one signal per sweep.
• CHoCH and BOS — swing-based structure breaks with running bias. Breaks against bias are CHoCH, with bias are BOS, styled separately.
• Swing points — three-candle fractals confirmed by closes back through, with swept-state fading, alternation, and equal high/low tagging for engineered liquidity.
• MTF structure dashboard — replaced the old corner readout. Seven configurable timeframe rows showing bullish/bearish/shifting, plus correlation scores.
• Timeframe-correlated swings — your pairing table baked in, so a 1H chart shows SH-D, a 15m chart shows SH-4H. HTF swings draw as extending lines that stop when swept, and merge into PDH/PWL labels when they coincide. Added 4H → Daily this evening.
Fixes
• Back-adjustment — comparison symbols were being fetched un-adjusted while your chart was adjusted, skewing the candle-sweep SMT. Now inherits chart settings.
• Weekly and monthly anchoring — my origin-matching tolerance was too strict, so PWH/PWL and PMH/PML fell back to the period start instead of connecting to the candle.
• Empty-array crash — Pine counts downward when a loop's end value is below its start, so iterating an empty array ran with index -1. Fixed in four places.
Versionshinweise
Swing points, paired across timeframesConfirmed swings detected as three-candle fractals, marked only once N of the last M candles have closed back through — tolerant of a stall candle, where a strict consecutive rule would miss real reversals. Alternation is enforced so swings read as structure rather than a cluster of same-side points.
Two layers run at once. The current timeframe marks plainly, while a correlated higher timeframe is labeled by its source — SH-D on a 1H chart, SH-4H on 15m — following a built-in pairing table (Daily on 4H and 1H, 8H on 30m, 4H on 15m, 2H on 10m, 1H on 5m, 30m on 3m, 15m on 1m), with an override for anything outside it. HTF swings draw as lines from the candle that established them, extending right until price sweeps them, then freezing and fading. Swings landing within tolerance of each other are tagged EQL/EQH as engineered liquidity.
Dealing range
Premium and discount made explicit. The range is built from the two most recent confirmed swings — selectable between the correlated HTF layer, the chart timeframe, or a swept-low-to-unswept-high read — with boundaries, 50% equilibrium and optional quarter levels. Each boundary anchors to its own origin candle, and the range expands when price trades beyond it so equilibrium stays meaningful between confirmations.
Draw on liquidity
Dashboard rows showing the nearest unswept liquidity above and below price, drawn from key levels and live swings, with distance in points, ticks or ATR. Nothing added to the chart — the levels are already there, this says which two price is running at.
Label de-clutter
Every level label registers in one priority pass. When several land at the same price, the highest-priority label absorbs the rest and they stop drawing — so PWL, a 4H swing low and the dealing range low read as one mark rather than three stacked. Full, compact (PWL +2) or primary-only display, with an optional hover listing everything at that price. They separate again the moment the prices stop agreeing.

Haftungsausschluss
Die Informationen und Veröffentlichungen sind nicht als Finanz-, Anlage-, Handels- oder andere Arten von Ratschlägen oder Empfehlungen gedacht, die von TradingView bereitgestellt oder gebilligt werden, und stellen diese nicht dar. Lesen Sie mehr in den Nutzungsbedingungen.
Haftungsausschluss
Die Informationen und Veröffentlichungen sind nicht als Finanz-, Anlage-, Handels- oder andere Arten von Ratschlägen oder Empfehlungen gedacht, die von TradingView bereitgestellt oder gebilligt werden, und stellen diese nicht dar. Lesen Sie mehr in den Nutzungsbedingungen.