Aktualisiert
Fundamentals Box
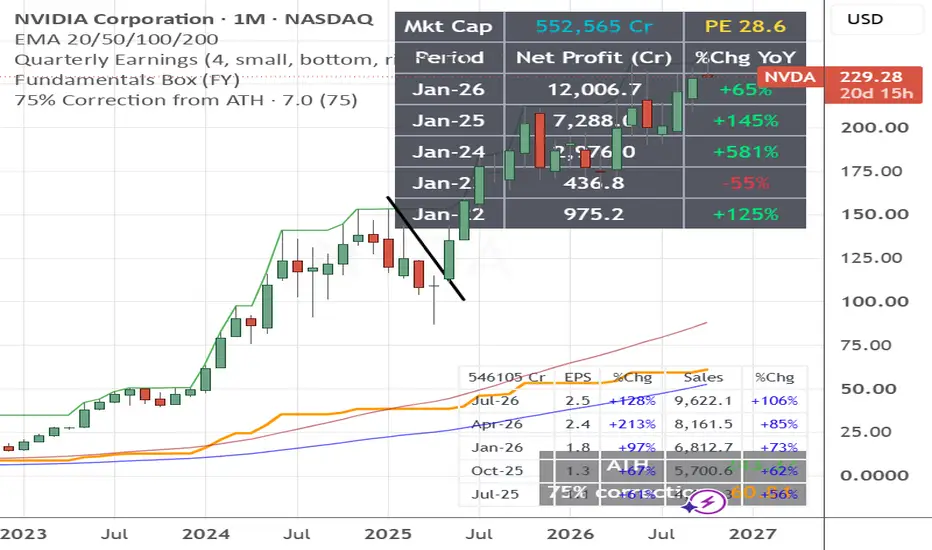
At the top of the box, it shows the company’s market cap in crores, calculated as shares outstanding multiplied by the current price. Next to it, it shows the PE ratio, which is market cap divided by net profit for the trailing twelve months. For loss-making companies, PE shows NA.
Below that is a table of net profit for the last five reported periods, with the latest period first. Each row also shows the percentage change versus the same period a year earlier, coloured green for growth and red for decline. In Settings, you can switch between yearly (FY) and quarterly (FQ) figures.
Compared with the indicator in your screenshot, I removed EPS and Sales and replaced them with net profit, market cap and PE.
Limitations: it works only on stocks, not forex or crypto, and period labels show the reporting date on TradingView. Values are in the company’s reporting currency.
Below that is a table of net profit for the last five reported periods, with the latest period first. Each row also shows the percentage change versus the same period a year earlier, coloured green for growth and red for decline. In Settings, you can switch between yearly (FY) and quarterly (FQ) figures.
Compared with the indicator in your screenshot, I removed EPS and Sales and replaced them with net profit, market cap and PE.
Limitations: it works only on stocks, not forex or crypto, and period labels show the reporting date on TradingView. Values are in the company’s reporting currency.
Versionshinweise
it shows the company’s market cap in crores, calculated as shares outstanding multiplied by the current price. Next to it, it shows the PE ratio, which is market cap divided by net profit for the trailing twelve months. For loss-making companies, PE shows NA.Below that is a table of net profit for the last five reported periods, with the latest period first. Each row also shows the percentage change versus the same period a year earlier, coloured green for growth and red for decline. In Settings, you can switch between yearly (FY) and quarterly (FQ) figures.
Compared with the indicator in your screenshot, I removed EPS and Sales and replaced them with net profit, market cap and PE.
Limitations: it works only on stocks, not forex or crypto, and period labels show the reporting date on TradingView. Values are in the company’s reporting currency.

Haftungsausschluss
Die Informationen und Veröffentlichungen sind nicht als Finanz-, Anlage-, Handels- oder andere Arten von Ratschlägen oder Empfehlungen gedacht, die von TradingView bereitgestellt oder gebilligt werden, und stellen diese nicht dar. Lesen Sie mehr in den Nutzungsbedingungen.
Haftungsausschluss
Die Informationen und Veröffentlichungen sind nicht als Finanz-, Anlage-, Handels- oder andere Arten von Ratschlägen oder Empfehlungen gedacht, die von TradingView bereitgestellt oder gebilligt werden, und stellen diese nicht dar. Lesen Sie mehr in den Nutzungsbedingungen.