Gideons Gold - EMA Shield
Gideons Gold — EMA Shield
EMA Shield provides a clear visual reference for where price stands. Inspired by the discipline of Gideon’s men holding their positions in Judges 7:21, it reflects our focus on preparation, patience, and a defined plan. At Gideons Gold, we aim to bring practical value to the trading community through focused, easy-to-use tools. Less Noise. Greater Focus.
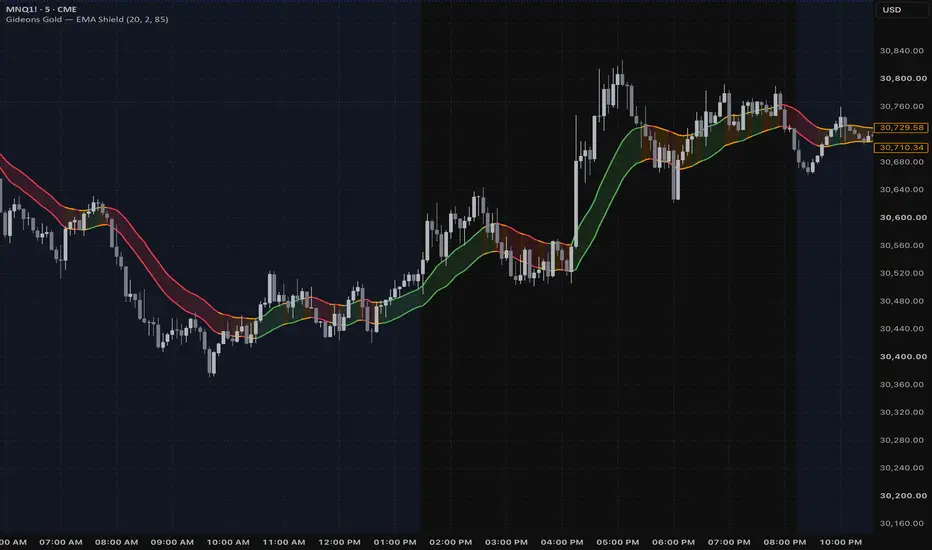
EMA Shield plots an EMA of candle highs and an EMA of candle lows to form a channel. The length defaults to 20 periods, but you can change it in settings to suit your approach.
Reading the colors:
- Green: The current close is above the upper EMA.
- Red: The current close is below the lower EMA.
- Orange: The current close is inside the channel or on either boundary.
Both lines and the optional fill change color together, making price’s position easy to recognize.
Features:
- Adjustable EMA length, defaulting to 20.
- Custom colors for above, below, and inside the channel.
- Adjustable line thickness from 1–5.
- Optional channel fill with customizable transparency.
Using EMA Shield
Use the channel alongside price structure and your own entry conditions to maintain a consistent view of price location. Orange identifies price within the channel; it does not automatically mean consolidation. Green and red identify price above or below the channel, not guaranteed trade opportunities.
The channel uses standard EMA calculations. Values and colors can change while a candle is forming. This version does not include built-in alert conditions or place trades. Despite its name, EMA Shield does not protect against trading losses.
The inspiration behind Gideons Gold
Gideon’s story inspires humility, discipline, and the reminder that more is not always better. We bring that perspective to clearer charts and purposeful tools. The biblical connection reflects our values, not a promise of trading success.
Less Noise. Greater Focus.
Clearer charts. Focused tools. A rules-based approach.
EMA Shield provides a clear visual reference for where price stands. Inspired by the discipline of Gideon’s men holding their positions in Judges 7:21, it reflects our focus on preparation, patience, and a defined plan. At Gideons Gold, we aim to bring practical value to the trading community through focused, easy-to-use tools. Less Noise. Greater Focus.
EMA Shield plots an EMA of candle highs and an EMA of candle lows to form a channel. The length defaults to 20 periods, but you can change it in settings to suit your approach.
Reading the colors:
- Green: The current close is above the upper EMA.
- Red: The current close is below the lower EMA.
- Orange: The current close is inside the channel or on either boundary.
Both lines and the optional fill change color together, making price’s position easy to recognize.
Features:
- Adjustable EMA length, defaulting to 20.
- Custom colors for above, below, and inside the channel.
- Adjustable line thickness from 1–5.
- Optional channel fill with customizable transparency.
Using EMA Shield
Use the channel alongside price structure and your own entry conditions to maintain a consistent view of price location. Orange identifies price within the channel; it does not automatically mean consolidation. Green and red identify price above or below the channel, not guaranteed trade opportunities.
The channel uses standard EMA calculations. Values and colors can change while a candle is forming. This version does not include built-in alert conditions or place trades. Despite its name, EMA Shield does not protect against trading losses.
The inspiration behind Gideons Gold
Gideon’s story inspires humility, discipline, and the reminder that more is not always better. We bring that perspective to clearer charts and purposeful tools. The biblical connection reflects our values, not a promise of trading success.
Less Noise. Greater Focus.
Clearer charts. Focused tools. A rules-based approach.

Haftungsausschluss
Die Informationen und Veröffentlichungen sind nicht als Finanz-, Anlage-, Handels- oder andere Arten von Ratschlägen oder Empfehlungen gedacht, die von TradingView bereitgestellt oder gebilligt werden, und stellen diese nicht dar. Lesen Sie mehr in den Nutzungsbedingungen.
Haftungsausschluss
Die Informationen und Veröffentlichungen sind nicht als Finanz-, Anlage-, Handels- oder andere Arten von Ratschlägen oder Empfehlungen gedacht, die von TradingView bereitgestellt oder gebilligt werden, und stellen diese nicht dar. Lesen Sie mehr in den Nutzungsbedingungen.