OPEN-SOURCE SCRIPT
Gap [Zemu]
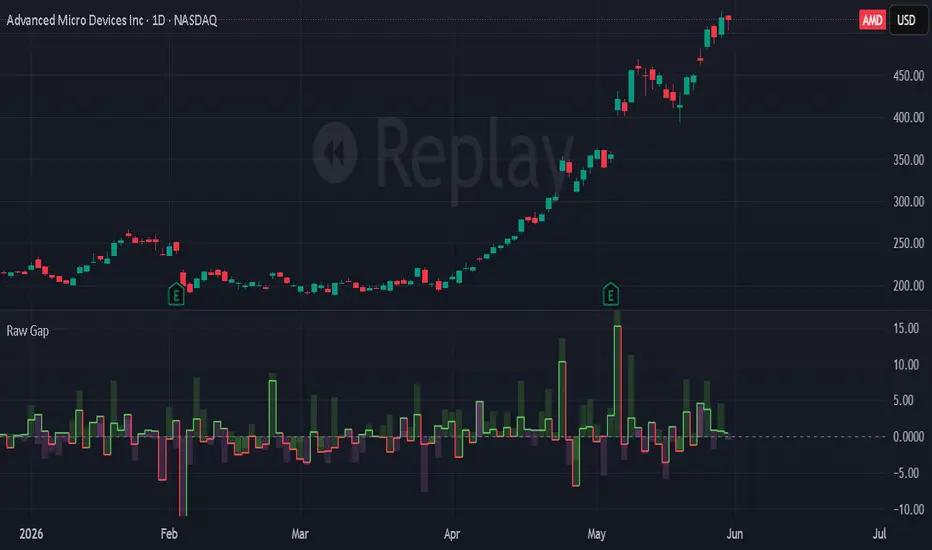
Gap [Zemu]
1. Description
Zemu is a gap continuation indicator focused on the relationship between overnight displacement and intraday follow-through. The indicator visualizes whether the opening imbalance was accepted, rejected, or faded during the session by comparing the gap against the subsequent intraday move. The goal is structural clarity, using a compact visual format to make continuation and failed continuation regimes easier to identify.

2. Features
Zemu plots the opening gap as a stepped bar structure, allowing overnight displacement to remain visually persistent throughout the session. Intraday follow-through and the combined net position are plotted as column structures using directional coloring derived from the intraday move. This allows continuation, disagreement, and reversal states to remain visually distinct without additional overlays or complexity.
Gap Calculation:
Pine Script®
Intraday Move:
Pine Script®
The indicator intentionally uses a minimal visual architecture focused on readability and interpretation.
3. Context
Overnight session gaps and subsequent intraday continuation dynamics are most pronounced due to exchange-based trading hours. Whilst primarily designed for stocks on the daily timeframe, this indicator can also be applied to indices, futures, and forex markets, although gap behavior in these instruments may exhibit weaker continuation characteristics depending on session overlap and trading structure. Cryptocurrency markets are generally less suited to the framework due to their continuous 24/7 trading environment.
4. Framework
Zemu is part of the ETMassif framework that is focused on price displacement and participation. Related work within the same research space examines how volume and price vectors interact during and after gap events, how wick-local participation reveals institutional activity at price extremes, and how persistent gap and wick levels continue to influence price structure over time.
日本語概要 (Japanese Summary)
Zemuは、ギャップ(窓開け)と当日の値動きの関係を可視化するためのインジケーターです。寄付き後にトレンドが継続したのか、ダマシ(失敗)に終わったのか、あるいはもみ合い(吸収)となったのかをシンプルな構造で表示します。ギャップはステップ(階段)構造として表示され、日中の値動きと合成されたネットポジションはカラム(柱状)形式で描画されます。視認性と構造の把握を重視し、不要な複雑化を避けた設計となっています。
中文概要(Chinese Summary)
Zemu 是一款用於分析跳空缺口與日內走勢關聯性的指標。本指標透過比較跳空缺口(Gap)與後續的日內走勢,藉此觀察市場對開盤失衡的延續、失敗或反轉表現。缺口以階梯式結構呈現,日內延續與淨位移則以柱狀圖(Column)形式顯示。整體設計強調簡潔、高可讀性與價格結構本身,避免過度複雜化。
Disclaimer:
This script is a research tool for market structure analysis and educational purposes only. It does not constitute financial advice. Trading involves risk.
1. Description
Zemu is a gap continuation indicator focused on the relationship between overnight displacement and intraday follow-through. The indicator visualizes whether the opening imbalance was accepted, rejected, or faded during the session by comparing the gap against the subsequent intraday move. The goal is structural clarity, using a compact visual format to make continuation and failed continuation regimes easier to identify.
2. Features
Zemu plots the opening gap as a stepped bar structure, allowing overnight displacement to remain visually persistent throughout the session. Intraday follow-through and the combined net position are plotted as column structures using directional coloring derived from the intraday move. This allows continuation, disagreement, and reversal states to remain visually distinct without additional overlays or complexity.
Gap Calculation:
Intraday Move:
The indicator intentionally uses a minimal visual architecture focused on readability and interpretation.
3. Context
Overnight session gaps and subsequent intraday continuation dynamics are most pronounced due to exchange-based trading hours. Whilst primarily designed for stocks on the daily timeframe, this indicator can also be applied to indices, futures, and forex markets, although gap behavior in these instruments may exhibit weaker continuation characteristics depending on session overlap and trading structure. Cryptocurrency markets are generally less suited to the framework due to their continuous 24/7 trading environment.
4. Framework
Zemu is part of the ETMassif framework that is focused on price displacement and participation. Related work within the same research space examines how volume and price vectors interact during and after gap events, how wick-local participation reveals institutional activity at price extremes, and how persistent gap and wick levels continue to influence price structure over time.
日本語概要 (Japanese Summary)
Zemuは、ギャップ(窓開け)と当日の値動きの関係を可視化するためのインジケーターです。寄付き後にトレンドが継続したのか、ダマシ(失敗)に終わったのか、あるいはもみ合い(吸収)となったのかをシンプルな構造で表示します。ギャップはステップ(階段)構造として表示され、日中の値動きと合成されたネットポジションはカラム(柱状)形式で描画されます。視認性と構造の把握を重視し、不要な複雑化を避けた設計となっています。
中文概要(Chinese Summary)
Zemu 是一款用於分析跳空缺口與日內走勢關聯性的指標。本指標透過比較跳空缺口(Gap)與後續的日內走勢,藉此觀察市場對開盤失衡的延續、失敗或反轉表現。缺口以階梯式結構呈現,日內延續與淨位移則以柱狀圖(Column)形式顯示。整體設計強調簡潔、高可讀性與價格結構本身,避免過度複雜化。
Disclaimer:
This script is a research tool for market structure analysis and educational purposes only. It does not constitute financial advice. Trading involves risk.
Open-source Skript
Ganz im Sinne von TradingView hat dieser Autor sein/ihr Script als Open-Source veröffentlicht. Auf diese Weise können nun auch andere Trader das Script rezensieren und die Funktionalität überprüfen. Vielen Dank an den Autor! Sie können das Script kostenlos verwenden, aber eine Wiederveröffentlichung des Codes unterliegt unseren Hausregeln.

Haftungsausschluss
Die Informationen und Veröffentlichungen sind nicht als Finanz-, Anlage-, Handels- oder andere Arten von Ratschlägen oder Empfehlungen gedacht, die von TradingView bereitgestellt oder gebilligt werden, und stellen diese nicht dar. Lesen Sie mehr in den Nutzungsbedingungen.
Open-source Skript
Ganz im Sinne von TradingView hat dieser Autor sein/ihr Script als Open-Source veröffentlicht. Auf diese Weise können nun auch andere Trader das Script rezensieren und die Funktionalität überprüfen. Vielen Dank an den Autor! Sie können das Script kostenlos verwenden, aber eine Wiederveröffentlichung des Codes unterliegt unseren Hausregeln.
Haftungsausschluss
Die Informationen und Veröffentlichungen sind nicht als Finanz-, Anlage-, Handels- oder andere Arten von Ratschlägen oder Empfehlungen gedacht, die von TradingView bereitgestellt oder gebilligt werden, und stellen diese nicht dar. Lesen Sie mehr in den Nutzungsbedingungen.