VWAP Anchored Kaufman Adaptive
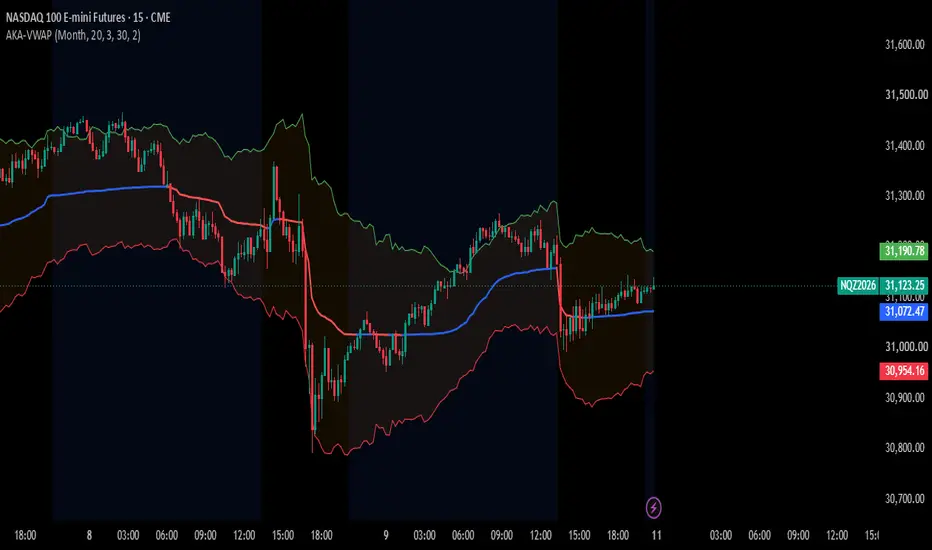
The Anchored Kaufman Adaptive VWAP is a VWAP-inspired line that resets at the start of each anchor period (Session, Week, Month, and so on) but, unlike a standard VWAP, does not weight all bars of the period equally. Instead it uses Kaufman’s adaptive smoothing:
When price is trending efficiently, the line reacts faster.
When price is choppy and noisy, the line smooths out and flattens.
Around the line, adaptive volatility bands also respond to market efficiency.
⚙️ How it works
1) Anchor reset
At the start of each chosen period (Session, Week, Month, Quarter, Year, Decade, Century), the calculation restarts, seeded from the first bar of the new period.
2) Kaufman Efficiency Ratio (ER)
ER = |net price change over N bars| ÷ (sum of absolute bar-to-bar changes over N bars), using the chosen source (default HLC3).
ER near 1 means a clean, directional move.
ER near 0 means noise and chop.
3) Adaptive smoothing constant
The ER is mapped to a smoothing constant between a fastest and a slowest EMA equivalent (defaults 2 and 30, as in Kaufman’s AMA), then squared:
SC = (ER × (fastSC − slowSC) + slowSC)²
4) Volume-weighted adaptive mean
Both price × volume and volume are smoothed with this adaptive constant. The line is their ratio:
AKA-VWAP = smoothed(price × volume) ÷ smoothed(volume)
This is an exponentially weighted, volume-weighted mean whose speed adapts to market efficiency. It is not the cumulative volume-weighted average of a classic VWAP.
5) Adaptive bands
Band distance = ATR × multiplier × (2 − ER)
In chop (low ER) the bands are up to about 2× wider, so noise stays inside them.
In strong trends (high ER) the bands are about 1× tighter, so a stretch from the mean is easier to see.
These are ATR-based bands, not standard deviation bands.
6) Line color
The line is blue when the source is above it and red when the source is below it. This is a simple bias cue, not a trade signal.
🧭 How to use it (step by step)
Use a futures chart with real volume (for example ES1!, NQ1!, GC1!, CL1!).
Pick the anchor to match your timeframe:
1m to 15m charts: Session
30m to 4h charts: Week
Daily charts: Month or Quarter
Weekly and higher: Year, Decade or Century
The anchor period must be longer than the chart timeframe. For example, a Session anchor on a daily chart resets on every bar, and the line will just follow price.
Read the line’s behavior:
Sloped line with tight bands: efficient trend. Pullbacks to the line are often watched for continuation.
Flat line with wide bands: choppy, balanced market. Reaction at the outer bands is often watched for mean reversion.
Read price versus the line:
Price holding above (blue) suggests buyers are in control relative to the adaptive volume-weighted mean.
Price holding below (red) suggests sellers are in control.
Read the bands: price outside a band means it is stretched relative to current volatility and efficiency. A stretched price in a strong trend can stay stretched, so it is not a reversal signal on its own.
Confirm with your own tools (market structure, order flow, key levels, session context, risk rules) before acting.
🎯 Tips for best performance
Efficiency Ratio Length: lower values (5–10) react faster but are noisier. Higher values (20–30) are smoother and slower.
Fastest / Slowest EMA Equivalent: the defaults (2 / 30) are Kaufman’s classic values. Widen the gap for a more dramatic fast/slow switch, or narrow it for a steadier line.
Volatility Band Multiplier: raise it for fewer band touches, lower it for more.
Early in a period the line is seeded from the first bar, so it can sit close to the opening value until enough bars accumulate. Give it time before leaning on it.
Use the Offset setting only for visual alignment.
Compare behavior across anchors, for example Session for intraday decisions and Week for broader context.
🔍 Limitations (please read)
Not a standard VWAP. The adaptive smoothing gives recent bars more influence than early-period bars, so values will differ from a classic anchored VWAP.
Volume dependent. Poor, tick-based or missing volume produces unreliable output.
ER is not reset at the anchor. Its lookback can include bars from before the new period.
Decade and Century anchors only make sense on very high timeframes with long history.
No built-in alerts or signals. The script plots only. You can still create alerts on price crossing the line or bands from TradingView’s alert dialog.
Results vary by symbol, timeframe and data feed.
This is NOT a holy grail. It does not predict price and does not generate buy or sell signals. It is a context and mean-reference tool that you combine with your own strategy, confirmation and risk management.
This is not a classic VWAP (see “How it works”). Do not expect it to match the built-in VWAP or your broker’s VWAP.
Nothing here is financial advice. Trading involves substantial risk of loss. Backtest and forward-test before using real money.
When price is trending efficiently, the line reacts faster.
When price is choppy and noisy, the line smooths out and flattens.
Around the line, adaptive volatility bands also respond to market efficiency.
⚙️ How it works
1) Anchor reset
At the start of each chosen period (Session, Week, Month, Quarter, Year, Decade, Century), the calculation restarts, seeded from the first bar of the new period.
2) Kaufman Efficiency Ratio (ER)
ER = |net price change over N bars| ÷ (sum of absolute bar-to-bar changes over N bars), using the chosen source (default HLC3).
ER near 1 means a clean, directional move.
ER near 0 means noise and chop.
3) Adaptive smoothing constant
The ER is mapped to a smoothing constant between a fastest and a slowest EMA equivalent (defaults 2 and 30, as in Kaufman’s AMA), then squared:
SC = (ER × (fastSC − slowSC) + slowSC)²
4) Volume-weighted adaptive mean
Both price × volume and volume are smoothed with this adaptive constant. The line is their ratio:
AKA-VWAP = smoothed(price × volume) ÷ smoothed(volume)
This is an exponentially weighted, volume-weighted mean whose speed adapts to market efficiency. It is not the cumulative volume-weighted average of a classic VWAP.
5) Adaptive bands
Band distance = ATR × multiplier × (2 − ER)
In chop (low ER) the bands are up to about 2× wider, so noise stays inside them.
In strong trends (high ER) the bands are about 1× tighter, so a stretch from the mean is easier to see.
These are ATR-based bands, not standard deviation bands.
6) Line color
The line is blue when the source is above it and red when the source is below it. This is a simple bias cue, not a trade signal.
🧭 How to use it (step by step)
Use a futures chart with real volume (for example ES1!, NQ1!, GC1!, CL1!).
Pick the anchor to match your timeframe:
1m to 15m charts: Session
30m to 4h charts: Week
Daily charts: Month or Quarter
Weekly and higher: Year, Decade or Century
The anchor period must be longer than the chart timeframe. For example, a Session anchor on a daily chart resets on every bar, and the line will just follow price.
Read the line’s behavior:
Sloped line with tight bands: efficient trend. Pullbacks to the line are often watched for continuation.
Flat line with wide bands: choppy, balanced market. Reaction at the outer bands is often watched for mean reversion.
Read price versus the line:
Price holding above (blue) suggests buyers are in control relative to the adaptive volume-weighted mean.
Price holding below (red) suggests sellers are in control.
Read the bands: price outside a band means it is stretched relative to current volatility and efficiency. A stretched price in a strong trend can stay stretched, so it is not a reversal signal on its own.
Confirm with your own tools (market structure, order flow, key levels, session context, risk rules) before acting.
🎯 Tips for best performance
Efficiency Ratio Length: lower values (5–10) react faster but are noisier. Higher values (20–30) are smoother and slower.
Fastest / Slowest EMA Equivalent: the defaults (2 / 30) are Kaufman’s classic values. Widen the gap for a more dramatic fast/slow switch, or narrow it for a steadier line.
Volatility Band Multiplier: raise it for fewer band touches, lower it for more.
Early in a period the line is seeded from the first bar, so it can sit close to the opening value until enough bars accumulate. Give it time before leaning on it.
Use the Offset setting only for visual alignment.
Compare behavior across anchors, for example Session for intraday decisions and Week for broader context.
🔍 Limitations (please read)
Not a standard VWAP. The adaptive smoothing gives recent bars more influence than early-period bars, so values will differ from a classic anchored VWAP.
Volume dependent. Poor, tick-based or missing volume produces unreliable output.
ER is not reset at the anchor. Its lookback can include bars from before the new period.
Decade and Century anchors only make sense on very high timeframes with long history.
No built-in alerts or signals. The script plots only. You can still create alerts on price crossing the line or bands from TradingView’s alert dialog.
Results vary by symbol, timeframe and data feed.
This is NOT a holy grail. It does not predict price and does not generate buy or sell signals. It is a context and mean-reference tool that you combine with your own strategy, confirmation and risk management.
This is not a classic VWAP (see “How it works”). Do not expect it to match the built-in VWAP or your broker’s VWAP.
Nothing here is financial advice. Trading involves substantial risk of loss. Backtest and forward-test before using real money.

Haftungsausschluss
Die Informationen und Veröffentlichungen sind nicht als Finanz-, Anlage-, Handels- oder andere Arten von Ratschlägen oder Empfehlungen gedacht, die von TradingView bereitgestellt oder gebilligt werden, und stellen diese nicht dar. Lesen Sie mehr in den Nutzungsbedingungen.
Haftungsausschluss
Die Informationen und Veröffentlichungen sind nicht als Finanz-, Anlage-, Handels- oder andere Arten von Ratschlägen oder Empfehlungen gedacht, die von TradingView bereitgestellt oder gebilligt werden, und stellen diese nicht dar. Lesen Sie mehr in den Nutzungsbedingungen.