OPEN-SOURCE SCRIPT
Aktualisiert DCA + DRIP Simulator [WynTrader]
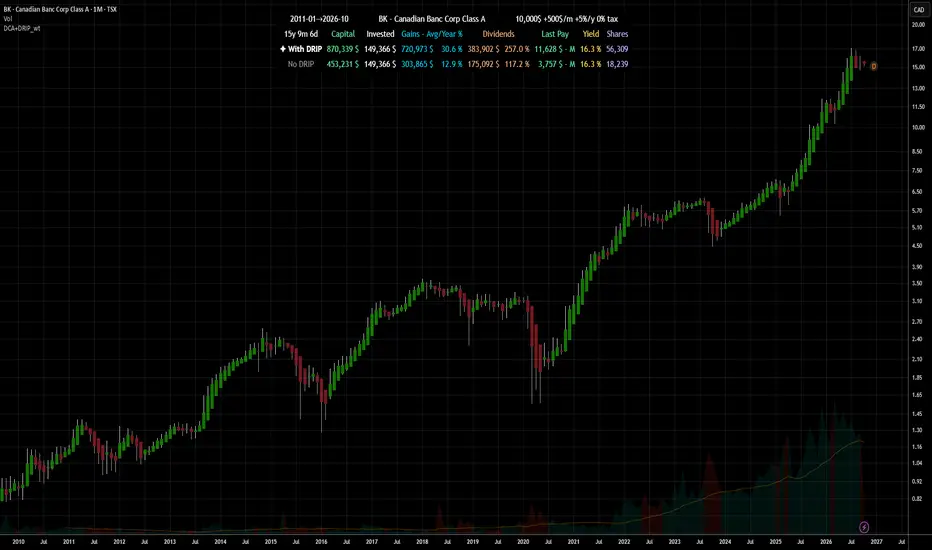
DCA + DRIP Simulator [WynTrader]
Hello my friend
This tool simulates real effect of an investment plan when a disciplined DCA+DRIP strategy compounds growth, compared to simply investing and pocketing the dividends. It applies to all kind of security with or without dividend paid, so you can compare what tickers you want..
This isn't a simplified estimate. It reads real price, dividend, and split data directly from TradingView — bar by bar, month by month — and reconstructs what a real investor would have experienced. Apply it to any security — dividend-paying or not, stock, ETF, closed-end fund — and see the picture side by side: with DRIP and no DRIP.
█ CONCEPTS
This indicator illustrates clearly that DCA+DRIP can build more wealth over time than a standard monthly investment approach where dividends are simply cashed out with no plan in mind.
— Dollar Cost Averaging (DCA) means investing a consistent amount every single month, no matter what the market does. When prices drop, your money buys more shares automatically. Over time, this discipline lowers your average cost and keeps emotion out of the equation.
— Dividend Re-Investment Plan (DRIP) means every dividend payment goes straight back into buying more shares, instead of sitting idle. Those extra shares generate their own dividends, which buy more shares — a compounding effect that grows the longer you stay invested.
Together, DCA + DRIP compound together over time.
█ HOW IT WORKS
Set your chart to MONTHLY intervals, else the table is set to zero.
Once configured, the indicator reads price, dividend, and split data directly from TradingView and simulates what a real investor would have experienced: buying every month (DCA), collecting dividends, reinvesting them automatically (DRIP) and adjust data with Splits.
█ FEATURES
Configurable DCA Parameters
Set your initial deposit, monthly contribution, and an optional annual DCA increase (e.g. +5%/yr to reflect salary growth and inflation over time). A withholding tax rate can also be applied for US-listed securities (e.g. 15% for ZQQ).
Flexible Date Range
The simulation runs from your chosen: a) Number of years to date; b) Start date to date; c) Visible chart from Start/End dates of your chart screen.
Side-by-Side Comparison
Every result is shown in two columns simultaneously — With DRIP and No DRIP. Capital, monthly dividend income, total dividends received, net gain, and share count — all at a glance.
Fully Customizable Table Display
Position, text size, and all colors are adjustable directly from the settings panel, so the table fits cleanly on any chart layout.
█ CONCLUSION
Load this indicator on any security — stock, ETF, closed-end fund, with or without dividends. DCA+DRIP Simulator applies to all of them, though DRIP's effect is most visible on dividend-paying securities, where reinvested dividends compound over time.
The difference between With DRIP and No DRIP can be significant over time.
█ WynTrader
I am not a Pine Script programmer — I am an investor who builds tools to support my own analysis, and maybe helps others. A few anomalies may have slipped through and there is likely room for improvement.
Hope you find this little tool useful. Enjoy!
WynTrader
Hello my friend
This tool simulates real effect of an investment plan when a disciplined DCA+DRIP strategy compounds growth, compared to simply investing and pocketing the dividends. It applies to all kind of security with or without dividend paid, so you can compare what tickers you want..
This isn't a simplified estimate. It reads real price, dividend, and split data directly from TradingView — bar by bar, month by month — and reconstructs what a real investor would have experienced. Apply it to any security — dividend-paying or not, stock, ETF, closed-end fund — and see the picture side by side: with DRIP and no DRIP.
█ CONCEPTS
This indicator illustrates clearly that DCA+DRIP can build more wealth over time than a standard monthly investment approach where dividends are simply cashed out with no plan in mind.
— Dollar Cost Averaging (DCA) means investing a consistent amount every single month, no matter what the market does. When prices drop, your money buys more shares automatically. Over time, this discipline lowers your average cost and keeps emotion out of the equation.
— Dividend Re-Investment Plan (DRIP) means every dividend payment goes straight back into buying more shares, instead of sitting idle. Those extra shares generate their own dividends, which buy more shares — a compounding effect that grows the longer you stay invested.
Together, DCA + DRIP compound together over time.
█ HOW IT WORKS
Set your chart to MONTHLY intervals, else the table is set to zero.
Once configured, the indicator reads price, dividend, and split data directly from TradingView and simulates what a real investor would have experienced: buying every month (DCA), collecting dividends, reinvesting them automatically (DRIP) and adjust data with Splits.
█ FEATURES
Configurable DCA Parameters
Set your initial deposit, monthly contribution, and an optional annual DCA increase (e.g. +5%/yr to reflect salary growth and inflation over time). A withholding tax rate can also be applied for US-listed securities (e.g. 15% for ZQQ).
Flexible Date Range
The simulation runs from your chosen: a) Number of years to date; b) Start date to date; c) Visible chart from Start/End dates of your chart screen.
Side-by-Side Comparison
Every result is shown in two columns simultaneously — With DRIP and No DRIP. Capital, monthly dividend income, total dividends received, net gain, and share count — all at a glance.
Fully Customizable Table Display
Position, text size, and all colors are adjustable directly from the settings panel, so the table fits cleanly on any chart layout.
█ CONCLUSION
Load this indicator on any security — stock, ETF, closed-end fund, with or without dividends. DCA+DRIP Simulator applies to all of them, though DRIP's effect is most visible on dividend-paying securities, where reinvested dividends compound over time.
The difference between With DRIP and No DRIP can be significant over time.
█ WynTrader
I am not a Pine Script programmer — I am an investor who builds tools to support my own analysis, and maybe helps others. A few anomalies may have slipped through and there is likely room for improvement.
Hope you find this little tool useful. Enjoy!
WynTrader
Versionshinweise
Some minor adjustments have been made to improve the overall appearance.Versionshinweise
- Updating of the Table presentation.- New option choosing "Visible Range" : calculations are made from the Current Chart data as seen on the screen.
Versionshinweise
Update - 2026-07-11:Versionshinweise
Minor adjustments calculation has been done.Versionshinweise
Just made minor adjustment calculation.Versionshinweise
Minor adjustments ;- Table defaults set to Middle Center position and Small size
- Start/End dates set to bigger size
- Net Gain Avg/y % = Net Gain $ / Total Invested / Nb-years-month * 100
Versionshinweise
UpdateTable results are still calculated using Monthly values exactly as before, even if the chart is set to a smaller interval (Daily or Weekly).
If the chart timeframe is smaller than Daily, the table returns zeros and displays the following message:
"Interval too small — use Daily, Weekly or Monthly"
Versionshinweise
Update- Fixed the end-of-period date on D/W/M so it matches the requested duration exactly (e.g. 2016-07 ⇒ 2026-07 for 10 years). No change to Capital, dividend, or % values.
Versionshinweise
Update : - Comments have been updated to reflects last changes.
Versionshinweise
Update — 2026-07-22Added a new row: Total Divid / Invest % — shows the percentage of all the dividends paid divided by the total amount invested for the present period.
- Reveals exactly how much more dividend income is generated when reinvested through DRIP.
- Can exceed 100% on high-yield names, as dividends alone surpass invested capital.
- C
Versionshinweise
Update 2026-07-26:A) In order to match TradingView's own chart values, Calculations have been adjusted to : capital, period start/end dates, initial buy price, current month day count, and last dividend label...
B) The Table results presentation has been improved as : parameters row moved under the title, column alignment fixed, dividend row relabeled and all dividend rows repositioned together.
Versionshinweise
Juste some minutes ago today, I loaded a version that was not full perfect, except a little noisy detail. But previous description remains unchanged.Versionshinweise
Update — 2026-07-26 23:25Apologies for the previous errors — everything has now been fixed in this latest version.
This DCA+DRIP simulator introduces functionality that is entirely new as a TradingView indicator. Nothing quite like it currently exists. As a result, it can sometimes be challenging to determine exactly how TradingView processes data internally, since this DCA+DRIP simulator must operate in full accordance with TradingView's internal calculations.
Versionshinweise
**Update — 2027-07-27**More precise calculations have been implemented.
My apologies for the frequent corrections over the past week. This project has proven exceptionally challenging to implement correctly.
Introducing both DCA and DRIP requires handling many complex exceptions to ensure the calculations are accurate and fully consistent. As far as I know, this may be the first TradingView indicator to fully implement this DCA+DRIP approach, which has made the development and validation process particularly demanding.
Furthermore, at least in Canada, I have not found any web-based tool that performs a true DCA+DRIP simulation. Most available calculators simply provide mathematical estimates and label them as "DRIP" simulations.
This indicator is doing something genuinely new on a TradingView chart by modeling the actual sequence of recurring purchases, dividend reinvestments, stock splits, and all related events over time, rather than relying on simplified mathematical approximations.
Versionshinweise
Updates (July 26, 2026 – August 8, 2026):* Visible Range Mode: Now includes the current month and correctly locks the end date.
* ADJ Button ON/OFF : Toggling adjustments on or off no longer alters capital, dividend, or stock split data.
* Calculations: Improved accuracy so figures more closely match TradingView (TV) chart values.
* Data Tables: The displayed end date now always matches the last month of data actually used.
Testing: Fully tested across multiple scenarios to ensure system stability and performance.
Versionshinweise
Update — 2026-08-09Bug: request.splits() — the Pine function used to detect splits — returns a date one month later than the split date actually shown on the chart, causing wrong DCA+DRIP calculations.
Fix: the script subtracts one month from the split date request.splits() returns, so it matches the split date on the chart — calculations are now more reliable.
Also in this update:
Price and dividend are used exactly as TradingView reports them — no adjustment, no recovery, no external data. TradingView's own price already reflects every future split; dividends are real, nominal $/share amounts.
The physical share increase at each split is now applied explicitly to shares already held, at the correct (corrected) month.
Versionshinweise
Update — 2026-08-13 : - Fixed invalid TradingView request on daily or weekly intervals
Versionshinweise
Update 2026-08-13 of yesterday was push with a wrong versionVersionshinweise
~~~ Updates2026-08-15 ~~~ Changed default settings; refined Capital and dividend display for accuracy.
2026-08-13 ~~~ Fixed dividends and splits detection on Daily and Weekly charts.
2026-08-09 ~~~ Corrected split dates to match what's shown on the chart.
2026-08-08 ~~~ Refined Visible Range, Adjust button ON/OFF detection, and calculations precision.
Versionshinweise
Update 2026-08-26Calculations now run on Daily data to guarantee exact results across Daily, Weekly, and Monthly intervals, rather than adjusting the data fit to the interval selected by the user.
This delivers more reliable, consistent results — with no small discrepancies between Daily, Weekly, and Monthly intervals.
Versionshinweise
Update 2026-08-26I just made an important update a few minutes ago.
I give you this last one to remove the debug parameter that I forgot in the input settings.
Versionshinweise
Updat2026-08-27- Fixed elapsed-day count on D, W, and M intervals.
- Comments also revised.
Versionshinweise
~~~ Update 2026-10-04 ~~~- New results table: Invested, Capital, Gains $ and Avg/Year %, Dividends $ and %, Last Pay, Yield and Shares, for With DRIP and No DRIP side by side.
- Last Pay replaces Last Dividend. It shows the last single dividend payment received, followed by its frequency: W (weekly), SM (semi-monthly), M (monthly), Q (quarterly), S (semi-annual), A (annual). The previous column added all payments of the last calendar month, which doubled the amount when two ex-dates fell in the same month.
- Yield (new column): last payment per share X payments per year / last price. A one-time special dividend is excluded, so it does not inflate the yield.
- Gains - Avg/Year % replaces Total Gain %. It is a simple yearly average: total gain divided by the number of years, not compounded.
- More realistic calendar: monthly deposits on the 1st trading day of each month, splits applied on their own day, dividends paid on shares held at the ex-date, and DRIP reinvested on the estimated payment day (10 trading days after the ex-date for funds, 20 for stocks).
- Display: Vertical table by default (easier to read on a phone) or Horizontal, text size from 8 to 16, a tooltip on every value. Table colors adapt to a dark or light chart background. Same dates and results on Daily, Weekly and Monthly charts.
Cross-checked on Daily, Weekly and Monthly charts, With and Without DRIP, against independent dividend and split records.
Versionshinweise
Display adjustments : - default table position is now Middle right
- with text size 11,
- and the symbol name shows a few more characters before being cut.
Versionshinweise
~~~ Update 2026-10-08 ~~~Display: new default layout (Horizontal, Top right), a better-aligned title line, and clearer, more vivid colors on both dark and white charts.
Versionshinweise
~~~ Update 2026-10-08 17h00 ~~~Default table now Top center with larger text (16).
The indicator table was not visible in the previous post's chart: the indicator was placed in the bottom pane, which TradingView did not show in the published chart image.
Open-source Skript
Ganz im Sinne von TradingView hat dieser Autor sein/ihr Script als Open-Source veröffentlicht. Auf diese Weise können nun auch andere Trader das Script rezensieren und die Funktionalität überprüfen. Vielen Dank an den Autor! Sie können das Script kostenlos verwenden, aber eine Wiederveröffentlichung des Codes unterliegt unseren Hausregeln.

WynTrader
Haftungsausschluss
Die Informationen und Veröffentlichungen sind nicht als Finanz-, Anlage-, Handels- oder andere Arten von Ratschlägen oder Empfehlungen gedacht, die von TradingView bereitgestellt oder gebilligt werden, und stellen diese nicht dar. Lesen Sie mehr in den Nutzungsbedingungen.
Open-source Skript
Ganz im Sinne von TradingView hat dieser Autor sein/ihr Script als Open-Source veröffentlicht. Auf diese Weise können nun auch andere Trader das Script rezensieren und die Funktionalität überprüfen. Vielen Dank an den Autor! Sie können das Script kostenlos verwenden, aber eine Wiederveröffentlichung des Codes unterliegt unseren Hausregeln.
WynTrader
Haftungsausschluss
Die Informationen und Veröffentlichungen sind nicht als Finanz-, Anlage-, Handels- oder andere Arten von Ratschlägen oder Empfehlungen gedacht, die von TradingView bereitgestellt oder gebilligt werden, und stellen diese nicht dar. Lesen Sie mehr in den Nutzungsbedingungen.