OPEN-SOURCE SCRIPT
Aktualisiert Universal MTF S&R v8 - Structural Zones & Local Swings
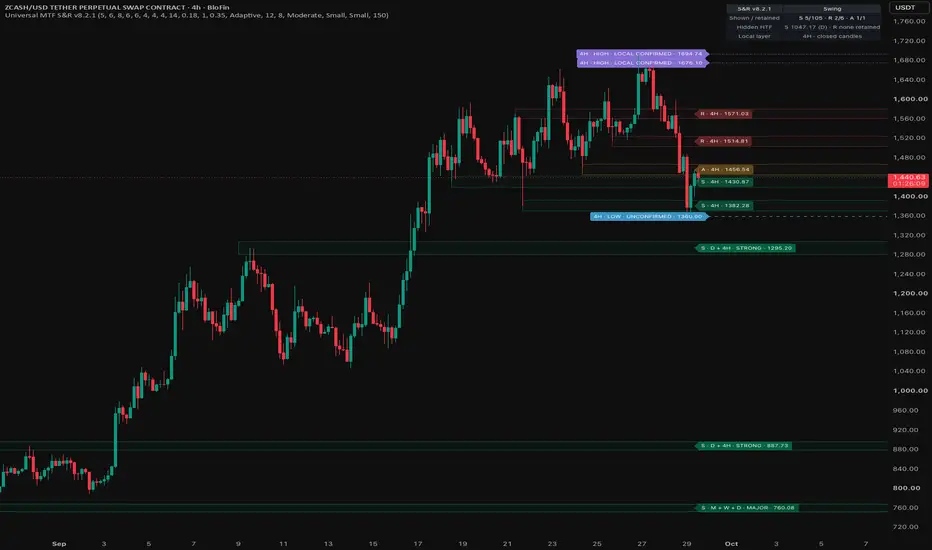
Universal MTF S&R v8 combines confirmed multi-timeframe support/resistance zones with an optional layer of recent local swing highs and lows.
The indicator was developed to answer two practical questions: where are the established structural levels, and which recent price levels might matter before a higher-timeframe pivot confirms?
Structural zones
The script collects confirmed pivots from Monthly, Weekly, Daily, 4H and optional 1H candles. Nearby levels can merge into zones, with widths based on source-timeframe ATR and a percentage cap.
Structural ranking considers timeframe importance, pivot prominence and repeated evidence. Overlap between different timeframes adds confluence. These ranks describe structural characteristics; they are not probabilities of a successful trade.
Zones are classified relative to the last completed chart candle:
• Green: support below price.
• Amber: price closed inside the zone.
• Red: resistance above price.
Developing and local levels
A separate layer displays recent highs and lows from completed candles. Candidates initially carry an UNCONFIRMED label. After surviving the configured number of subsequent source candles, they become LOCAL CONFIRMED.
A completed candle’s wick beyond a level removes it. Levels also expire, and the retained history is limited to two highs and two lows. Local confirmation does not increase structural rank.
The local source can use the chart timeframe or a separately selected timeframe. For example, a 4H chart can display 1H local swings alongside higher-timeframe structural zones.
Suggested use
Start with the default settings on standard candlestick charts. Adjust the local source, visible level count and labels to suit your analysis. Colours, line styles and label appearance are configurable.
An optional Fibonacci overlay uses rolling highs and lows from completed candles.
Timing and limitations
Structural pivots require right-side confirmation candles. Structural boxes extend back to their originating pivots, but those levels were only identified after confirmation. Local lines begin when their candidates first become observable.
Local levels update from completed source candles, so they can lag intrabar moves. Candidates can disappear, and confirmed local levels can later break or expire. Available history and feed revisions can affect the displayed results.
The absence of a nearby structural zone does not imply an unobstructed price path. This indicator provides chart context; it does not generate entry signals, execute trades or establish trading performance.
Chart examples
ETH 4H: higher-timeframe support, active zones and resistance alongside developing and locally confirmed swings.

APT 4H: the recent 0.8888 local high and developing local low illustrate why no nearby structural resistance does not mean clear runway.

The indicator was developed to answer two practical questions: where are the established structural levels, and which recent price levels might matter before a higher-timeframe pivot confirms?
Structural zones
The script collects confirmed pivots from Monthly, Weekly, Daily, 4H and optional 1H candles. Nearby levels can merge into zones, with widths based on source-timeframe ATR and a percentage cap.
Structural ranking considers timeframe importance, pivot prominence and repeated evidence. Overlap between different timeframes adds confluence. These ranks describe structural characteristics; they are not probabilities of a successful trade.
Zones are classified relative to the last completed chart candle:
• Green: support below price.
• Amber: price closed inside the zone.
• Red: resistance above price.
Developing and local levels
A separate layer displays recent highs and lows from completed candles. Candidates initially carry an UNCONFIRMED label. After surviving the configured number of subsequent source candles, they become LOCAL CONFIRMED.
A completed candle’s wick beyond a level removes it. Levels also expire, and the retained history is limited to two highs and two lows. Local confirmation does not increase structural rank.
The local source can use the chart timeframe or a separately selected timeframe. For example, a 4H chart can display 1H local swings alongside higher-timeframe structural zones.
Suggested use
Start with the default settings on standard candlestick charts. Adjust the local source, visible level count and labels to suit your analysis. Colours, line styles and label appearance are configurable.
An optional Fibonacci overlay uses rolling highs and lows from completed candles.
Timing and limitations
Structural pivots require right-side confirmation candles. Structural boxes extend back to their originating pivots, but those levels were only identified after confirmation. Local lines begin when their candidates first become observable.
Local levels update from completed source candles, so they can lag intrabar moves. Candidates can disappear, and confirmed local levels can later break or expire. Available history and feed revisions can affect the displayed results.
The absence of a nearby structural zone does not imply an unobstructed price path. This indicator provides chart context; it does not generate entry signals, execute trades or establish trading performance.
Chart examples
ETH 4H: higher-timeframe support, active zones and resistance alongside developing and locally confirmed swings.
APT 4H: the recent 0.8888 local high and developing local low illustrate why no nearby structural resistance does not mean clear runway.
Versionshinweise
v8.2.1 - Clearer charts, adaptive detail and calculation correctionsThis update keeps the original purpose: showing multi-timeframe support/resistance structure alongside a separate developing/local swing layer. The changes improve readability, selection of relevant zones and transparency about how the information is calculated.
1. New timeframe-adaptive display
The default Adaptive view adjusts the amount of displayed structure to the chart interval:
- Daily and above - Overview: up to 4 support and 4 resistance zones.
- Above 1H and below Daily - Swing: up to 5 zones per side.
- 1H and below - Detail: up to 6 zones per side.
Up to two zones containing the last closed price are displayed separately as active zones. A lower user-defined ceiling still applies.
The aim is to show broader structure on higher timeframes and more surrounding detail on lower timeframes. This responds to changing the chart interval, not mouse zoom or window resizing. The developing/local layer is hidden in Adaptive Overview to reduce clutter.
2. Better balance between nearby levels and historical structure
In v8, ranking alone could fill the display with strong historical zones while hiding closer, lower-ranked levels.
Adaptive selection protects the nearest retained support and resistance, reserves eligible higher-timeframe context, and uses volatility-based distance limits for additional detail on intraday charts.
A Full map option provides a broader, manually controlled view, including an adjustable reserve for nearby zones. It still has a display cap; it does not show every retained candidate.
Filtering affects visibility, not the stored candidates. Hidden zones have not been deleted, although available history, enabled sources and retention limits still determine what the indicator can retain.
3. Cleaner zones and more informative labels
Zone fills are substantially lighter and borders thinner, reducing the appearance of one continuous green or red background.
When labels are enabled, every displayed structural zone now receives a compact label, including lower-ranked zones. Labels can show the zone's center price, while tooltips provide its boundaries, contributing timeframes and scoring details.
The label-rank setting now controls additional detail and emphasis instead of leaving weaker zones unnamed. A short label does not mean the structural pivot is unconfirmed.
The large guide has been replaced by a compact summary showing the current display profile, displayed versus retained zones, nearest hidden higher-timeframe levels and local-layer status.
4. Corrections to calculation and scoring
- Pivot prominence: now measures the smaller price excursion on either side of a pivot, normalized by ATR, and excludes the pivot candle from both surrounding windows. This avoids a large one-sided move or pivot candle dominating the measurement.
- Repeated observations: the first pivot from each timeframe is no longer counted again as repeat evidence on top of its timeframe contribution. Additional merged pivots are observations, not independently verified retests.
- Optional Fibonacci: removes an unnecessary extra candle of delay and suppresses retracements when both range extremes occur on the same candle, where their chronological order is unknown.
These corrections can change structural ranks compared with v8. Scores remain heuristic rankings, not calibrated probabilities.
5. Data handling and consistency
Local-level handling now checks source-data freshness and observation cutoffs, including during replay. Missing or stale local data is explicitly flagged rather than silently displaying an old snapshot as current.
The v8.2.1 patch also addresses two Pine calculation-consistency warnings by preparing historical price and ATR values outside conditional drawing functions.
Important interpretation
The adaptive display does not narrow zone boundaries or change their rank simply to make the chart cleaner. Overlapping zones remain possible.
Empty chart space does not prove that no support or resistance exists. Structural pivots require confirmation; local lines remain separate and may break, expire or be replaced. Historical boxes project the current selected map back to pivot origins, rather than recording signals that were available at every past candle.
Any bug report, feature request or comment is welcome.
Open-source Skript
Ganz im Sinne von TradingView hat dieser Autor sein/ihr Script als Open-Source veröffentlicht. Auf diese Weise können nun auch andere Trader das Script rezensieren und die Funktionalität überprüfen. Vielen Dank an den Autor! Sie können das Script kostenlos verwenden, aber eine Wiederveröffentlichung des Codes unterliegt unseren Hausregeln.

Haftungsausschluss
Die Informationen und Veröffentlichungen sind nicht als Finanz-, Anlage-, Handels- oder andere Arten von Ratschlägen oder Empfehlungen gedacht, die von TradingView bereitgestellt oder gebilligt werden, und stellen diese nicht dar. Lesen Sie mehr in den Nutzungsbedingungen.
Open-source Skript
Ganz im Sinne von TradingView hat dieser Autor sein/ihr Script als Open-Source veröffentlicht. Auf diese Weise können nun auch andere Trader das Script rezensieren und die Funktionalität überprüfen. Vielen Dank an den Autor! Sie können das Script kostenlos verwenden, aber eine Wiederveröffentlichung des Codes unterliegt unseren Hausregeln.
Haftungsausschluss
Die Informationen und Veröffentlichungen sind nicht als Finanz-, Anlage-, Handels- oder andere Arten von Ratschlägen oder Empfehlungen gedacht, die von TradingView bereitgestellt oder gebilligt werden, und stellen diese nicht dar. Lesen Sie mehr in den Nutzungsbedingungen.