CandelaCharts - Auto Anchored Footprint
📝 Overview
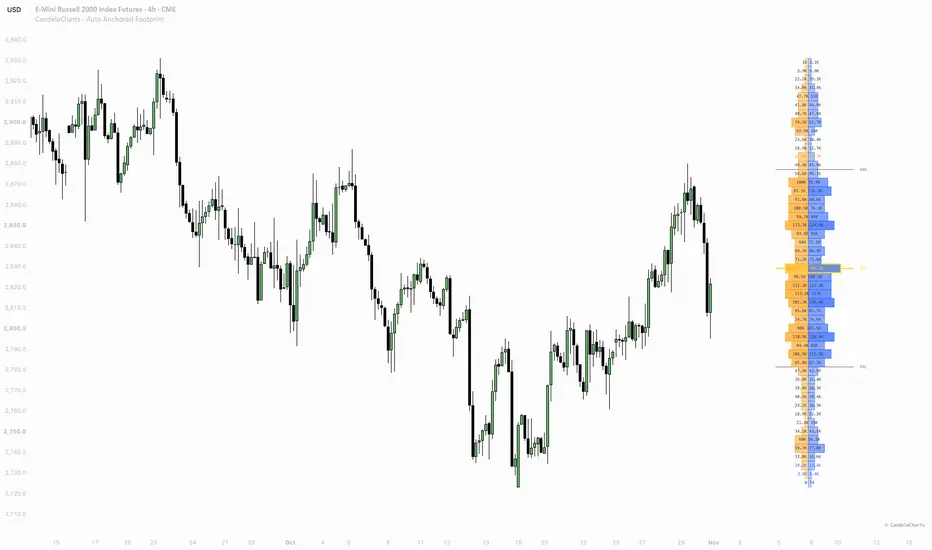
The CandelaCharts - Auto Anchored Footprint is an institutional-grade Order Flow and Market Microstructure indicator engineered exclusively for TradingView.
Unlike conventional static volume profiles or fixed-anchor tools, this indicator features an intelligent Dynamic Viewport Engine. As you pan, drag back into historical data, or zoom on your chart, the indicator automatically recalculates the complete Bid x Ask footprint ladder, Auction Value Area (VAH/VAL), Point of Control (POC), Net Delta, and Order Flow Imbalances for the exact visible window currently displayed on your screen.

Whether conducting forensic historical backtesting on past market regimes or executing live intraday setups at the hard right edge of the chart, the Auto Anchored Footprint ensures institutional volume distribution is always right where your eyes are.
📦 Features
⚙️ Settings
⚡️ Showcase
Auto-Anchored Visible Footprint

Order Flow Imbalance Clusters

Auction Market Value Area & Extended Levels

📒 Usage
🚨 Alerts
⚠️ Disclaimer
Trading involves significant risk, and many participants may incur losses. The content on this site is not intended as financial advice and should not be interpreted as such. Decisions to buy, sell, hold, or trade securities, commodities, or other financial instruments carry inherent risks and are best made with guidance from qualified financial professionals. Past performance is not indicative of future results.
The CandelaCharts - Auto Anchored Footprint is an institutional-grade Order Flow and Market Microstructure indicator engineered exclusively for TradingView.
Unlike conventional static volume profiles or fixed-anchor tools, this indicator features an intelligent Dynamic Viewport Engine. As you pan, drag back into historical data, or zoom on your chart, the indicator automatically recalculates the complete Bid x Ask footprint ladder, Auction Value Area (VAH/VAL), Point of Control (POC), Net Delta, and Order Flow Imbalances for the exact visible window currently displayed on your screen.
Whether conducting forensic historical backtesting on past market regimes or executing live intraday setups at the hard right edge of the chart, the Auto Anchored Footprint ensures institutional volume distribution is always right where your eyes are.
📦 Features
- Auto-Anchored Viewport Calculation: Automatically re-evaluates and anchors the entire footprint calculation to your visible chart window in real time. Pan back 6 months, 2 years, or 5 days ago—the footprint instantly adapts.
- Full Bid x Ask Order Flow Ladder: Renders granular order flow ladders displaying executed market sell volume (Bid, left) and market buy volume (Ask, right) across every individual price rung.
- Institutional Value Area (70% AMT): Employs Auction Market Theory algorithm expanding from the Point of Control to map the 70% Value Area High (VAH) and Value Area Low (VAL).
- Point of Control (POC) Node: Highlights the highest volume node of the visible window with an accent border and horizontal reference ray.
- Diagonal Order Flow Imbalance Detection: Automatically detects aggressive diagonal market buying and selling imbalances (e.g. 3:1 / 300% ratio) and visually highlights imbalanced price rungs with accent borders.
- Adaptive Historical Fallback Engine: Uses lower timeframe (LTF) intrabar tick aggregation when available. When scrolling into deep history where lower timeframe data limits are reached, the calculation engine seamlessly falls back to chart timeframe price action, guaranteeing zero blank screens or calculation breaks.
- Adaptive Tape Budgeting: The visible window shares a fixed intrabar sample budget. On very wide windows or ultra low LTF sources the intrabar samples are grouped into OHLCV slices, so every bar keeps its full traded volume and price envelope at a coarser resolution instead of overloading the platform.
- Flexible Ladder Placement: Pin the footprint ladder to the Right Edge of the visible window (stays next to historical candles as you scroll) or to the Left Edge.
- Dynamic Gradient Engine & Monospace Overlay: Volume intensity shading with customizable palettes (Teal-Red, Teal-Navy, Blue-Orange, Green-Red, etc.) and monospace volume numerical overlays (compact K/M or raw).
⚙️ Settings
- Anchor & Window: Configure Anchor Mode (Visible Window or Fixed Lookback Bars), lookback candle count, lower timeframe (LTF) source for intrabar volume sampling, and vertical row resolution.
- Footprint Ladder: Customize ladder placement (Right or Left Edge), offset bars, footprint ladder width, volume scaling (Square Root, Logarithmic, Linear), volume number display mode (All Rows, Significant Only, POC Only, Imbalances Only), large number abbreviation (K/M), and dynamic volume color gradients.
- Auction Market Levels: Toggle Value Area boundaries (VAH/VAL), target Value Area percentage (default 70%), POC highlighting, extended horizontal reference rays across the visible chart, and POC/VAH/VAL text labels with price display.
- Order Flow Imbalances: Toggle diagonal aggressive buying and selling imbalance accent borders, customize the imbalance ratio multiplier (e.g., 3.0 = 300%), and set a minimum volume threshold to filter out noise.
- Themes & Styles: Select from curated CandelaCharts color presets (Teal - Red, Teal - Orange, Teal - Navy, Green - Red, Blue - Orange, Blue - Pink, Cyan - Purple, Brown - Black) or switch to Custom mode to fine-tune Ask, Bid, POC, Value Area, and monospace text colors.
⚡️ Showcase
Auto-Anchored Visible Footprint
Order Flow Imbalance Clusters
Auction Market Value Area & Extended Levels
📒 Usage
- Value Area Acceptance vs. Rejection: In balanced or consolidating market regimes, monitor price action around VAH and VAL. A failed probe above VAH that re-enters value often triggers a rotation straight to the POC and VAL.
- Point of Control (POC) Magnet & Support/Resistance: The high-volume POC acts as institutional fair value. When price trends away from POC, pullbacks to the extended POC line frequently offer prime high-liquidity mitigation entries.
- Diagonal Imbalance Stack Confirmation: Look for stacked buying imbalances at key structural lows as confirmation that aggressive institutional market buyers have absorbed passive limit sellers and initiated a directional move.
- Delta Divergence & Absorption: When the visible window registers extreme positive delta while price is struggling at VAH resistance, institutional passive selling (absorption) is taking place, preceding a sharp liquidity sweep downward.
- Historical Playbook Review: Simply scroll your chart back to any major news event, market open, or macro pivot. The indicator automatically reconstructs the exact volume ladder and auction profile of that specific historical period.
🚨 Alerts
- POC Shift Alert: Can be monitored through the real-time HUD when the highest volume node transitions to a new price tier.
- Imbalance Surge: Triggers when aggressive buying or selling imbalances cross threshold counts in the visible window.
⚠️ Disclaimer
Trading involves significant risk, and many participants may incur losses. The content on this site is not intended as financial advice and should not be interpreted as such. Decisions to buy, sell, hold, or trade securities, commodities, or other financial instruments carry inherent risks and are best made with guidance from qualified financial professionals. Past performance is not indicative of future results.

🔵 Tools that give you the edge: candelacharts.com/.
🔵 Join our free discord for updates: candelacharts.com/community
🔵 Join our free discord for updates: candelacharts.com/community
Haftungsausschluss
Die Informationen und Veröffentlichungen sind nicht als Finanz-, Anlage-, Handels- oder andere Arten von Ratschlägen oder Empfehlungen gedacht, die von TradingView bereitgestellt oder gebilligt werden, und stellen diese nicht dar. Lesen Sie mehr in den Nutzungsbedingungen.
🔵 Tools that give you the edge: candelacharts.com/.
🔵 Join our free discord for updates: candelacharts.com/community
🔵 Join our free discord for updates: candelacharts.com/community
Haftungsausschluss
Die Informationen und Veröffentlichungen sind nicht als Finanz-, Anlage-, Handels- oder andere Arten von Ratschlägen oder Empfehlungen gedacht, die von TradingView bereitgestellt oder gebilligt werden, und stellen diese nicht dar. Lesen Sie mehr in den Nutzungsbedingungen.