OPEN-SOURCE SCRIPT
Strongest Price Nodes
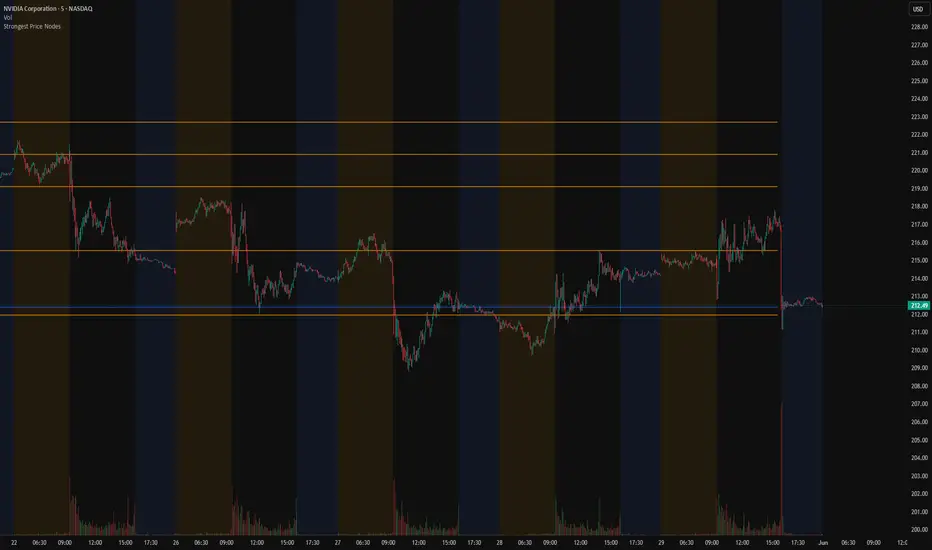
Strongest Price Nodes highlights the price levels where the market has built the strongest activity across recent sessions.
Instead of displaying a full profile or filling the chart with too many levels, this indicator extracts only the most important price nodes and plots them directly on the chart as clean decision levels.
These nodes represent areas where price has spent time, traded volume, or built both time and volume together.
In simple terms, the indicator helps answer one question: Where has the market shown the strongest acceptance?
What It Shows? The indicator plots two types of nodes:
1. Historical Price Nodes
Historical nodes are calculated from completed sessions using the selected lookback period.
They show where the strongest market participation occurred in recent history.
These levels can act as important areas for reaction, support, resistance, retest, breakout confirmation, or mean reversion.
2. Developing Session Node
The developing session node shows the strongest value area forming during the current session.
It updates live as the session develops.To keep the chart clean, the developing session node is always limited to one level.
Calculation Modes The indicator includes three profile modes:
This mode is useful for identifying stronger acceptance zones because it combines participation with time spent at price.
Why These Nodes Matter
Display Controls
Nodes can be displayed as lines or ATR-based zones.
ATR-based zones adjust automatically with market volatility.
The extension mode can also be controlled.
You can choose to stop levels at session end, extend them for a fixed number of bars, extend them to the right, extend them to the left, or extend them in both directions.
This helps keep the chart clean and avoids unnecessary infinite lines when they are not needed.
How Traders Can Use It
The indicator works best when combined with price action, VWAP, session highs and lows, trend context, and volume behavior.
Summary
Strongest Price Nodes is built for traders who want a cleaner way to identify important price levels.
It focuses only on the strongest areas of market activity and removes unnecessary profile clutter.
The goal is not to predict direction.
The goal is to show where the market has accepted price and where the next important reaction may happen.
Instead of displaying a full profile or filling the chart with too many levels, this indicator extracts only the most important price nodes and plots them directly on the chart as clean decision levels.
These nodes represent areas where price has spent time, traded volume, or built both time and volume together.
In simple terms, the indicator helps answer one question: Where has the market shown the strongest acceptance?
What It Shows? The indicator plots two types of nodes:
1. Historical Price Nodes
Historical nodes are calculated from completed sessions using the selected lookback period.
They show where the strongest market participation occurred in recent history.
These levels can act as important areas for reaction, support, resistance, retest, breakout confirmation, or mean reversion.
2. Developing Session Node
The developing session node shows the strongest value area forming during the current session.
It updates live as the session develops.To keep the chart clean, the developing session node is always limited to one level.
Calculation Modes The indicator includes three profile modes:
- Volume
Finds price levels where the most volume traded. - Time
Finds price levels where price spent the most time. - Volume x Time
Finds price levels where both volume and time align.
This mode is useful for identifying stronger acceptance zones because it combines participation with time spent at price.
Why These Nodes Matter
- Strong price nodes often become important market reference points.
- Price may pause around them, reject from them, retest them after a breakout, rotate back toward them, or use them as support or resistance.
- A strong node is not a buy or sell signal by itself. It is a decision zone. What matters is how price behaves when it reaches the node.
Display Controls
Nodes can be displayed as lines or ATR-based zones.
ATR-based zones adjust automatically with market volatility.
The extension mode can also be controlled.
You can choose to stop levels at session end, extend them for a fixed number of bars, extend them to the right, extend them to the left, or extend them in both directions.
This helps keep the chart clean and avoids unnecessary infinite lines when they are not needed.
How Traders Can Use It
- Use historical nodes to mark important prior value areas.
- Use the developing node to understand where the current session is building value.
- If price holds above a node, it may suggest acceptance.
- If price rejects from a node, it may suggest failed acceptance.
- If price breaks away and later retests the node, it can become a useful continuation or reversal area.
The indicator works best when combined with price action, VWAP, session highs and lows, trend context, and volume behavior.
Summary
Strongest Price Nodes is built for traders who want a cleaner way to identify important price levels.
It focuses only on the strongest areas of market activity and removes unnecessary profile clutter.
The goal is not to predict direction.
The goal is to show where the market has accepted price and where the next important reaction may happen.
Open-source Skript
Ganz im Sinne von TradingView hat dieser Autor sein/ihr Script als Open-Source veröffentlicht. Auf diese Weise können nun auch andere Trader das Script rezensieren und die Funktionalität überprüfen. Vielen Dank an den Autor! Sie können das Script kostenlos verwenden, aber eine Wiederveröffentlichung des Codes unterliegt unseren Hausregeln.

Machine-learning market structure & forecast levels. Publishing levels before the markets move. Educational only.
Haftungsausschluss
Die Informationen und Veröffentlichungen sind nicht als Finanz-, Anlage-, Handels- oder andere Arten von Ratschlägen oder Empfehlungen gedacht, die von TradingView bereitgestellt oder gebilligt werden, und stellen diese nicht dar. Lesen Sie mehr in den Nutzungsbedingungen.
Open-source Skript
Ganz im Sinne von TradingView hat dieser Autor sein/ihr Script als Open-Source veröffentlicht. Auf diese Weise können nun auch andere Trader das Script rezensieren und die Funktionalität überprüfen. Vielen Dank an den Autor! Sie können das Script kostenlos verwenden, aber eine Wiederveröffentlichung des Codes unterliegt unseren Hausregeln.
Machine-learning market structure & forecast levels. Publishing levels before the markets move. Educational only.
Haftungsausschluss
Die Informationen und Veröffentlichungen sind nicht als Finanz-, Anlage-, Handels- oder andere Arten von Ratschlägen oder Empfehlungen gedacht, die von TradingView bereitgestellt oder gebilligt werden, und stellen diese nicht dar. Lesen Sie mehr in den Nutzungsbedingungen.