Aktualisiert
Sattam | Volume Edge

Sattam | Volume Edge
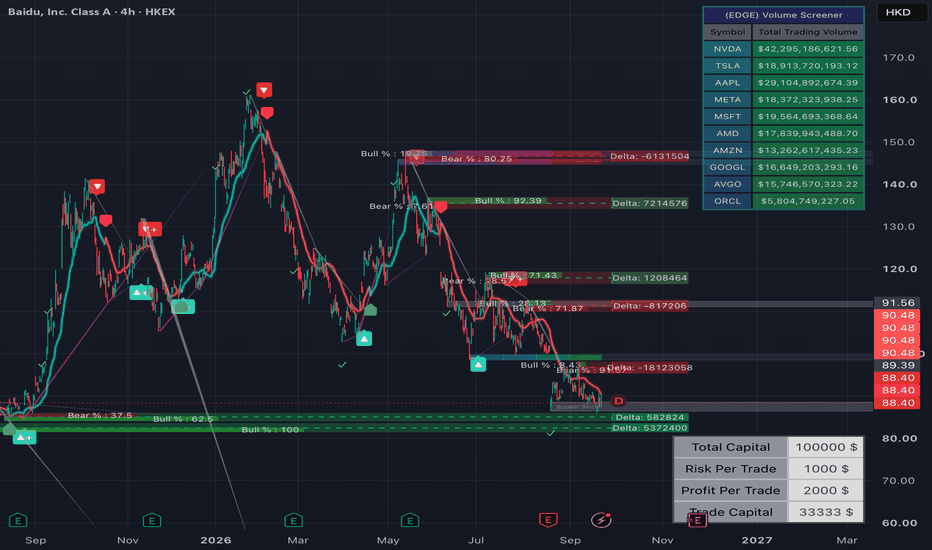
Volume Edge is a multi-module chart toolkit that reads price structure through the lens of volume. Every module can be switched on or off from the "Modules" group, so the chart shows only what you need.
Trend Signals — an ATR-based trailing trend (hl2 SuperTrend-style, band = 1.1 × (Sensitivity + 2) × ATR(25)). Bar colours follow the trend; Buy/Sell labels mark flips, and a "+" is appended when the flip agrees with a 186-period WMA filter. TP1/TP2 checkmarks appear when price reaches 1× / 2.5× the band from the entry bar.
Liquidity — pivot highs/lows (10 left / 5 right) become resistance/support zones sized by ATR(300). Each zone shows the buy/sell split of the pivot candle's volume and a running Delta of the volume traded inside it, and is retired once price closes through it.
ORB — Opening Range Breakout for a user-defined session and UTC offset: session background, range high/low/mid lines, gradient fills, and one breakout/breakdown signal per session on a close through the range.
TrendLines — swing trendlines from consecutive pivot lows (rising support) or pivot highs (falling resistance). Preset sets the pivot length (Small 10/5 … Macro 30/15). Lines are drawn as time-linear wedges extended 75 bars past the confirming pivot; "History" keeps all past lines, otherwise only the last N.
Order Blocks — the wick zone of a swing candle is stored with its volume. Each later bar that trades inside the zone consumes a proportional share of that volume; the label shows the remaining volume with a rating (High ≥ 9%, Medium ≥ 3%, Low ≥ 2% of the 20-day average daily volume). A block expires when its volume is exhausted, or turns into a grey Breaker Block if that option is enabled.
RMI Trend — a momentum trend that averages RSI and MFI; the range-weighted MA ribbon flips colour when momentum crosses the positive/negative thresholds.
Capital Risk — a position-sizing table: capital, risk per trade, target per trade (RR ratio) and the position size implied by the stop-loss %.
Volume Screener — a table of daily dollar volume (close × volume) for up to 40 symbols of your choice; only enabled symbols are listed, tinted green above the "Trading Capital" threshold (in millions) and red below. Both tables can be placed in any of nine screen positions, and a single switch hides or shows them together.
Nothing here predicts the future; the modules describe what price and volume are doing so you can make your own decisions. Works on any symbol and timeframe.
The RMI Trend module reuses code from the open-source "RMI Trend Sniper" by TZack88 (Mozilla Public License 2.0).
Sattam | Volume Edge
Volume Edge مجموعة أدوات متعددة الوحدات تقرأ بنية السعر من زاوية الحجم. كل وحدة تُفعَّل أو تُعطَّل من مجموعة "Modules" فلا يظهر على الشارت إلا ما تحتاجه.
Trend Signals — اتجاه متتبّع مبني على ATR (بأسلوب SuperTrend على hl2، عرض النطاق = 1.1 × (الحساسية + 2) × ATR(25)). تتلوّن الشموع مع الاتجاه، وتظهر علامات Buy/Sell عند الانعكاس مع "+" عندما يتوافق الانعكاس مع فلتر WMA بطول 186. تظهر علامات TP1/TP2 عند بلوغ السعر 1× / 2.5× من عرض النطاق من شمعة الدخول.
Liquidity — قمم وقيعان محورية (10 يسار / 5 يمين) تتحول إلى مناطق مقاومة/دعم بارتفاع مشتق من ATR(300). كل منطقة تعرض نسبة الشراء/البيع من حجم شمعة البيفوت وDelta متراكماً للحجم المتداول داخلها، وتُزال عند الإغلاق خارجها.
ORB — اختراق نطاق الافتتاح لجلسة يحددها المستخدم مع فارق UTC: خلفية للجلسة، خطوط أعلى/أدنى/منتصف النطاق، تعبئة متدرجة، وإشارة اختراق/كسر واحدة لكل جلسة عند الإغلاق خارج النطاق.
TrendLines — خطوط اتجاه من قيعان محورية متتالية (دعم صاعد) أو قمم محورية (مقاومة هابطة). الإعداد المسبق يحدد طول البيفوت (Small 10/5 … Macro 30/15). تُرسم كأسافين خطية بالزمن تمتد 75 شمعة بعد البيفوت المؤكِّد؛ "History" يحفظ كل الخطوط السابقة وإلا يبقى آخر N منها.
Order Blocks — تُحفظ منطقة ذيل الشمعة المحورية مع حجمها، وكل شمعة لاحقة تتداول داخلها تستهلك نصيباً متناسباً من هذا الحجم. يعرض النص الحجم المتبقي مع تقييم (High ≥ 9%، Medium ≥ 3%، Low ≥ 2% من متوسط الحجم اليومي لعشرين يوماً). ينتهي البلوك عند نفاد حجمه، أو يتحول إلى Breaker Block رمادي إن فُعّل الخيار.
RMI Trend — اتجاه زخم يجمع متوسط RSI وMFI؛ شريط المتوسط المرجّح بالمدى يبدّل لونه عند تجاوز الزخم لحدّي الإيجاب والسلب.
Capital Risk — جدول لحجم الصفقة: رأس المال، المخاطرة لكل صفقة، الهدف لكل صفقة (نسبة RR)، وحجم المركز المشتق من نسبة وقف الخسارة.
Volume Screener — جدول بالحجم الدولاري اليومي (الإغلاق × الحجم) لما يصل إلى 40 رمزاً تختارها؛ تُعرض الرموز المفعّلة فقط، بلون أخضر فوق حد "Trading Capital" (بالملايين) وأحمر تحته. يمكن وضع الجدولين في أيٍّ من تسعة مواضع على الشاشة، وزر واحد يخفيهما أو يظهرهما معاً.
لا شيء هنا يتنبأ بالمستقبل؛ الوحدات تصف ما يفعله السعر والحجم لتتخذ قرارك بنفسك. يعمل على أي رمز وأي إطار زمني.
وحدة RMI Trend تعيد استخدام كود مفتوح المصدر من "RMI Trend Sniper" للمؤلف TZack88 (رخصة Mozilla Public License 2.0).
Volume Edge is a multi-module chart toolkit that reads price structure through the lens of volume. Every module can be switched on or off from the "Modules" group, so the chart shows only what you need.
Trend Signals — an ATR-based trailing trend (hl2 SuperTrend-style, band = 1.1 × (Sensitivity + 2) × ATR(25)). Bar colours follow the trend; Buy/Sell labels mark flips, and a "+" is appended when the flip agrees with a 186-period WMA filter. TP1/TP2 checkmarks appear when price reaches 1× / 2.5× the band from the entry bar.
Liquidity — pivot highs/lows (10 left / 5 right) become resistance/support zones sized by ATR(300). Each zone shows the buy/sell split of the pivot candle's volume and a running Delta of the volume traded inside it, and is retired once price closes through it.
ORB — Opening Range Breakout for a user-defined session and UTC offset: session background, range high/low/mid lines, gradient fills, and one breakout/breakdown signal per session on a close through the range.
TrendLines — swing trendlines from consecutive pivot lows (rising support) or pivot highs (falling resistance). Preset sets the pivot length (Small 10/5 … Macro 30/15). Lines are drawn as time-linear wedges extended 75 bars past the confirming pivot; "History" keeps all past lines, otherwise only the last N.
Order Blocks — the wick zone of a swing candle is stored with its volume. Each later bar that trades inside the zone consumes a proportional share of that volume; the label shows the remaining volume with a rating (High ≥ 9%, Medium ≥ 3%, Low ≥ 2% of the 20-day average daily volume). A block expires when its volume is exhausted, or turns into a grey Breaker Block if that option is enabled.
RMI Trend — a momentum trend that averages RSI and MFI; the range-weighted MA ribbon flips colour when momentum crosses the positive/negative thresholds.
Capital Risk — a position-sizing table: capital, risk per trade, target per trade (RR ratio) and the position size implied by the stop-loss %.
Volume Screener — a table of daily dollar volume (close × volume) for up to 40 symbols of your choice; only enabled symbols are listed, tinted green above the "Trading Capital" threshold (in millions) and red below. Both tables can be placed in any of nine screen positions, and a single switch hides or shows them together.
Nothing here predicts the future; the modules describe what price and volume are doing so you can make your own decisions. Works on any symbol and timeframe.
The RMI Trend module reuses code from the open-source "RMI Trend Sniper" by TZack88 (Mozilla Public License 2.0).
Sattam | Volume Edge
Volume Edge مجموعة أدوات متعددة الوحدات تقرأ بنية السعر من زاوية الحجم. كل وحدة تُفعَّل أو تُعطَّل من مجموعة "Modules" فلا يظهر على الشارت إلا ما تحتاجه.
Trend Signals — اتجاه متتبّع مبني على ATR (بأسلوب SuperTrend على hl2، عرض النطاق = 1.1 × (الحساسية + 2) × ATR(25)). تتلوّن الشموع مع الاتجاه، وتظهر علامات Buy/Sell عند الانعكاس مع "+" عندما يتوافق الانعكاس مع فلتر WMA بطول 186. تظهر علامات TP1/TP2 عند بلوغ السعر 1× / 2.5× من عرض النطاق من شمعة الدخول.
Liquidity — قمم وقيعان محورية (10 يسار / 5 يمين) تتحول إلى مناطق مقاومة/دعم بارتفاع مشتق من ATR(300). كل منطقة تعرض نسبة الشراء/البيع من حجم شمعة البيفوت وDelta متراكماً للحجم المتداول داخلها، وتُزال عند الإغلاق خارجها.
ORB — اختراق نطاق الافتتاح لجلسة يحددها المستخدم مع فارق UTC: خلفية للجلسة، خطوط أعلى/أدنى/منتصف النطاق، تعبئة متدرجة، وإشارة اختراق/كسر واحدة لكل جلسة عند الإغلاق خارج النطاق.
TrendLines — خطوط اتجاه من قيعان محورية متتالية (دعم صاعد) أو قمم محورية (مقاومة هابطة). الإعداد المسبق يحدد طول البيفوت (Small 10/5 … Macro 30/15). تُرسم كأسافين خطية بالزمن تمتد 75 شمعة بعد البيفوت المؤكِّد؛ "History" يحفظ كل الخطوط السابقة وإلا يبقى آخر N منها.
Order Blocks — تُحفظ منطقة ذيل الشمعة المحورية مع حجمها، وكل شمعة لاحقة تتداول داخلها تستهلك نصيباً متناسباً من هذا الحجم. يعرض النص الحجم المتبقي مع تقييم (High ≥ 9%، Medium ≥ 3%، Low ≥ 2% من متوسط الحجم اليومي لعشرين يوماً). ينتهي البلوك عند نفاد حجمه، أو يتحول إلى Breaker Block رمادي إن فُعّل الخيار.
RMI Trend — اتجاه زخم يجمع متوسط RSI وMFI؛ شريط المتوسط المرجّح بالمدى يبدّل لونه عند تجاوز الزخم لحدّي الإيجاب والسلب.
Capital Risk — جدول لحجم الصفقة: رأس المال، المخاطرة لكل صفقة، الهدف لكل صفقة (نسبة RR)، وحجم المركز المشتق من نسبة وقف الخسارة.
Volume Screener — جدول بالحجم الدولاري اليومي (الإغلاق × الحجم) لما يصل إلى 40 رمزاً تختارها؛ تُعرض الرموز المفعّلة فقط، بلون أخضر فوق حد "Trading Capital" (بالملايين) وأحمر تحته. يمكن وضع الجدولين في أيٍّ من تسعة مواضع على الشاشة، وزر واحد يخفيهما أو يظهرهما معاً.
لا شيء هنا يتنبأ بالمستقبل؛ الوحدات تصف ما يفعله السعر والحجم لتتخذ قرارك بنفسك. يعمل على أي رمز وأي إطار زمني.
وحدة RMI Trend تعيد استخدام كود مفتوح المصدر من "RMI Trend Sniper" للمؤلف TZack88 (رخصة Mozilla Public License 2.0).
Versionshinweise
Trend Signals — an ATR-based trailing trend (hl2 SuperTrend-style, band = 1.1 × (Sensitivity + 2) × ATR(25)). Bar colours follow the trend; Buy/Sell labels mark flips, and a "+" is appended when the flip agrees with a 186-period WMA filter. TP1/TP2 checkmarks appear when price reaches 1× / 2.5× the band from the entry bar.Trailing TP — after each Buy signal a green trailing take-profit line (SuperTrend of ATR(10) × an adjustable factor, default 2.1) follows the move and disappears once price closes below it:
Trend Signals — اتجاه متتبّع مبني على ATR (بأسلوب SuperTrend على hl2، عرض النطاق = 1.1 × (الحساسية + 2) × ATR(25)). تتلوّن الشموع مع الاتجاه، وتظهر علامات Buy/Sell عند الانعكاس مع "+" عندما يتوافق الانعكاس مع فلتر WMA بطول 186. تظهر علامات TP1/TP2 عند بلوغ السعر 1× / 2.5× من عرض النطاق من شمعة الدخول.
Trailing TP — بعد كل إشارة Buy يظهر خط أخضر لهدف متحرّك (SuperTrend بطول ATR(10) × معامل قابل للتعديل، افتراضيه 2.1) يتتبّع الصعود ويختفي عندما يغلق السعر تحته:
Versionshinweise
v1.1 — No-repaint update• All signals, the Trailing TP line, liquidity zones, order blocks and trendlines are now confirmed on bar close and are never removed afterwards.
• New: Trailing TP — a green trailing take-profit line after each Buy signal (SuperTrend ATR(10) × 2.1, adjustable).
• Table position options (9 positions) and a single switch for both tables.
• Volume Screener lists only the enabled symbols, with no empty cells.
🔄 تحديث Sattam | Volume Edge — v1.1
✅ إصلاح إعادة الرسم (Repainting): الإشارات وخط Trailing TP ومناطق السيولة والبلوكات وخطوط الاتجاه تُثبَّت الآن عند إغلاق الشمعة ولا تُحذف بعدها.
📈 جديد: Trailing TP — خط أخضر لهدف متحرّك بعد كل إشارة Buy (SuperTrend ATR(10) × 2.1، قابل للتعديل).
📍 خيارات موضع الجداول (9 مواضع) وزر واحد لإخفاء الجدولين.
📊 ماسح الحجم يعرض الرموز المفعّلة فقط بلا خلايا فارغة.
🔗
التحديث يصل تلقائياً لمن أضاف المؤشر.
Versionshinweise
Trailing TP — after a Buy signal a green trailing take-profit line follows the move, and after a Sell signal a red one mirrors it (SuperTrend of ATR(10) × an adjustable factor, default 2.1); each line ends once price closes through it.Versionshinweise
Added alerts for the trend Buy/Sell signals and TP1/TP2 hits (previously only ORB and RMI had alerts).
Haftungsausschluss
Die Informationen und Veröffentlichungen sind nicht als Finanz-, Anlage-, Handels- oder andere Arten von Ratschlägen oder Empfehlungen gedacht, die von TradingView bereitgestellt oder gebilligt werden, und stellen diese nicht dar. Lesen Sie mehr in den Nutzungsbedingungen.
Haftungsausschluss
Die Informationen und Veröffentlichungen sind nicht als Finanz-, Anlage-, Handels- oder andere Arten von Ratschlägen oder Empfehlungen gedacht, die von TradingView bereitgestellt oder gebilligt werden, und stellen diese nicht dar. Lesen Sie mehr in den Nutzungsbedingungen.