Colored Bollinger BandWidth [AMLQ]
Overview
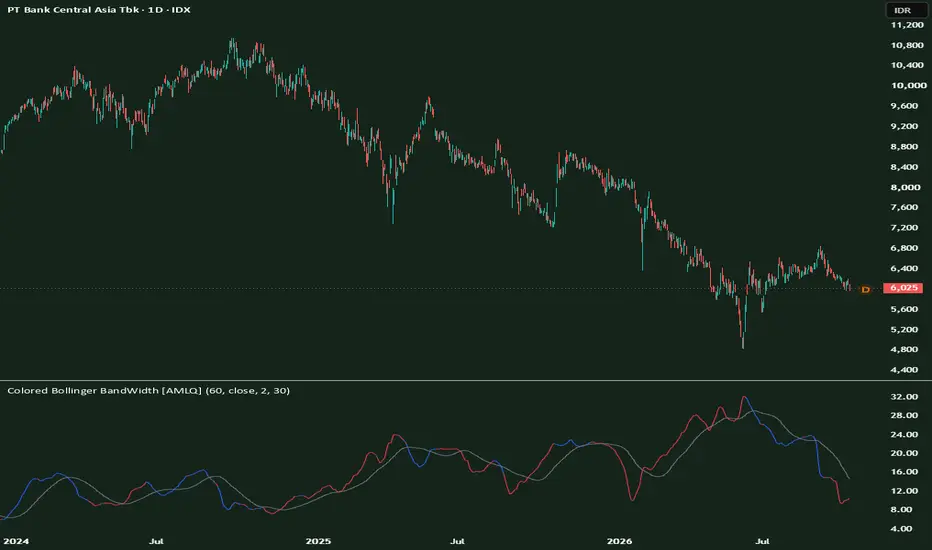
This indicator tracks market volatility cycles by isolating Bollinger BandWidth (BBW) into an oscillator panel. It pairs standard volatility measurements with a directional trend filter and historical boundary channels, making it easy to identify volatility squeezes, breakout expansions, and market exhaustion points.
Core Components & Mechanics
Bollinger BandWidth (BBW): Calculated as ((Upper Band - Lower Band) / Basis) * 100 using a 60-period length and 2.0 standard deviations. It measures the percentage spread between bands relative to the mean.
Trend-Biased Coloring:
60-Period BBW SMA (Gray Line): A simple moving average of the BandWidth itself. Acts as a baseline filter to determine whether current volatility is expanding or contracting relative to its 60-bar average.
Highest Expansion (Red Boundary): The 125-bar rolling maximum of BBW. Highlights peak volatility levels where moves are historically stretched.
Lowest Contraction (Green Boundary): The 125-bar rolling minimum of BBW. Pinpoints extreme compression zones where explosive breakouts originate.
Trading Rules & Setups
Volatility Squeeze (Setup Zone):
Bullish Breakout (Long Entry):
Bearish Breakdown (Short Entry):
Volatility Exhaustion (Take Profit / Tighten Stops):
Pine Script Implementation Note
In the script, the variable ma60 is set to ta.sma(src, 30) rather than a 60-period length. To align the code with the naming and indicator title, update that calculation to ta.sma(src, 60) or declare it as an adjustable input parameter.
This indicator tracks market volatility cycles by isolating Bollinger BandWidth (BBW) into an oscillator panel. It pairs standard volatility measurements with a directional trend filter and historical boundary channels, making it easy to identify volatility squeezes, breakout expansions, and market exhaustion points.
Core Components & Mechanics
Bollinger BandWidth (BBW): Calculated as ((Upper Band - Lower Band) / Basis) * 100 using a 60-period length and 2.0 standard deviations. It measures the percentage spread between bands relative to the mean.
Trend-Biased Coloring:
- Blue Line: Price is trading above the trend baseline (Close > SMA). Signals bullish momentum.
- Red Line: Price is trading below the trend baseline (Close < SMA). Signals bearish momentum.
60-Period BBW SMA (Gray Line): A simple moving average of the BandWidth itself. Acts as a baseline filter to determine whether current volatility is expanding or contracting relative to its 60-bar average.
Highest Expansion (Red Boundary): The 125-bar rolling maximum of BBW. Highlights peak volatility levels where moves are historically stretched.
Lowest Contraction (Green Boundary): The 125-bar rolling minimum of BBW. Pinpoints extreme compression zones where explosive breakouts originate.
Trading Rules & Setups
Volatility Squeeze (Setup Zone):
- When the BBW line hugs or tests the green lowest contraction line, price is heavily compressed. Avoid chop trading and prepare for a high-momentum breakout.
Bullish Breakout (Long Entry):
- The BBW line crosses above its gray 60-period SMA while plotted in Blue. This confirms that volatility is accelerating in the direction of an upward trend.
Bearish Breakdown (Short Entry):
- The BBW line crosses above its gray 60-period SMA while plotted in Red. This confirms that volatility is expanding in the direction of a downward trend.
Volatility Exhaustion (Take Profit / Tighten Stops):
- When the BBW line nears the red highest expansion line, volatility has reached statistical extremes. Expect consolidation, pullbacks, or sideways drift rather than continuation.
Pine Script Implementation Note
In the script, the variable ma60 is set to ta.sma(src, 30) rather than a 60-period length. To align the code with the naming and indicator title, update that calculation to ta.sma(src, 60) or declare it as an adjustable input parameter.

CFTe with an award and Trading System Designer.
Check our events and workshops at alphamarketlab.com/.
See our scripts at scripts.alphamarketlab.com/.
Join AMLQ Society at community.alphamarketlab.com/.
Check our events and workshops at alphamarketlab.com/.
See our scripts at scripts.alphamarketlab.com/.
Join AMLQ Society at community.alphamarketlab.com/.
Haftungsausschluss
Die Informationen und Veröffentlichungen sind nicht als Finanz-, Anlage-, Handels- oder andere Arten von Ratschlägen oder Empfehlungen gedacht, die von TradingView bereitgestellt oder gebilligt werden, und stellen diese nicht dar. Lesen Sie mehr in den Nutzungsbedingungen.
CFTe with an award and Trading System Designer.
Check our events and workshops at alphamarketlab.com/.
See our scripts at scripts.alphamarketlab.com/.
Join AMLQ Society at community.alphamarketlab.com/.
Check our events and workshops at alphamarketlab.com/.
See our scripts at scripts.alphamarketlab.com/.
Join AMLQ Society at community.alphamarketlab.com/.
Haftungsausschluss
Die Informationen und Veröffentlichungen sind nicht als Finanz-, Anlage-, Handels- oder andere Arten von Ratschlägen oder Empfehlungen gedacht, die von TradingView bereitgestellt oder gebilligt werden, und stellen diese nicht dar. Lesen Sie mehr in den Nutzungsbedingungen.