Boursa Kuwait Sectors Performance
Boursa Kuwait Sectors Performance
OVERVIEW
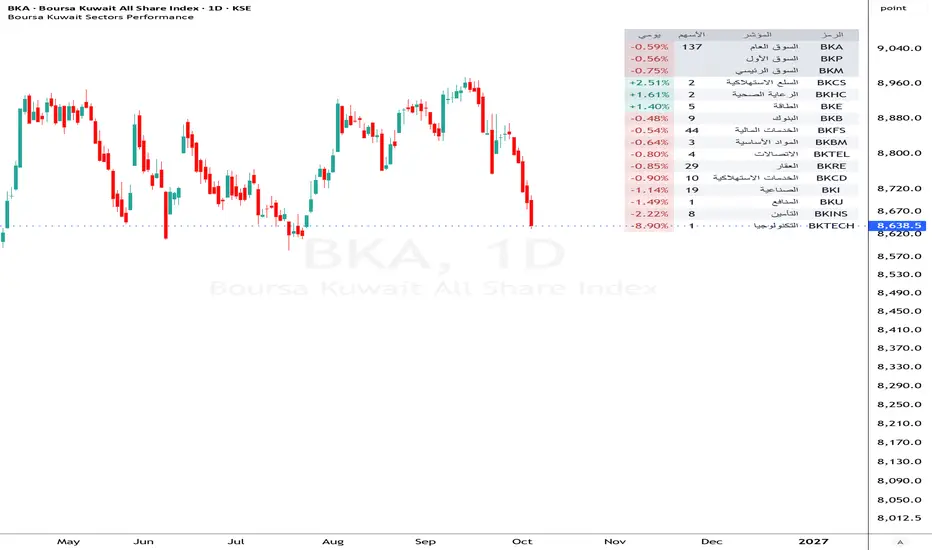
A compact table that shows the performance of the 13 Boursa Kuwait sector indices alongside the three market indices (All Share BKA, Premier Market BKP, Main Market BKM) in a single view. It is designed for traders who follow sector rotation in the Kuwaiti market and want to see at a glance which sectors are leading or lagging the overall market.
WHAT IT ADDS
- All Boursa Kuwait sector and market indices in one sortable table, on any chart symbol.
- The comparison period follows the chart timeframe, so one script covers daily, weekly, monthly, quarterly and yearly views.
- Relative change versus the All Share Index (BKA) for every sector.
- The number of listed stocks per sector, to put each move in context: a one-stock sector behaves very differently from a 44-stock sector.
- A native right-to-left Arabic layout, with a full English mode.
HOW IT WORKS
- For each index, the script requests the current and previous close on the chart timeframe and calculates: (close / previous close - 1) x 100.
- Daily chart = daily change, weekly = weekly, monthly = monthly, 3M = quarterly, 12M = yearly. On intraday charts the table shows the daily change. The column header names the active period.
- RS vs BKA = sector change minus BKA change on the same timeframe, in percentage points. Positive means the sector outperformed the market over that period. The same value appears as a tooltip when hovering over each change cell; it can also be shown as a separate column.
- Sectors can be sorted by change, by RS vs BKA, or by number of stocks, ascending or descending. Sectors with no data are always placed at the bottom.
HOW TO USE
Add the script to any chart; it does not depend on the chart symbol. Change the chart timeframe to change the comparison period. Sort by change or RS vs BKA to see which sectors are outperforming or underperforming the market.
SETTINGS
- Language: Arabic (default, right-to-left layout) or English.
- Sort By and direction; Market Rows on/off; Ticker and Stocks columns on/off; RS vs BKA column on/off.
- Position, Top Offset (empty rows so the table does not cover the chart buttons), Text Size.
- Theme: Auto (follows the chart background), Dark, Light, or Custom colours. Up / Down / Flat colours apply in every theme.
ARABIC INTERFACE - ENGLISH TRANSLATIONS
Headers: الرمز = Ticker | المؤشر = Index | الأسهم = Stocks | مقابل العام = vs BKA | يومي = Daily | أسبوعي = Weekly | شهري = Monthly | ربعي = Quarterly | سنوي = Yearly
Markets: السوق العام = All Share (BKA) | السوق الأول = Premier Market (BKP) | السوق الرئيسي = Main Market (BKM)
Sectors: البنوك = Banks (BKB) | الخدمات المالية = Financial Services (BKFS) | العقار = Real Estate (BKRE) | الصناعية = Industrials (BKI) | الخدمات الاستهلاكية = Consumer Discretionary (BKCD) | التأمين = Insurance (BKINS) | الطاقة = Energy (BKE) | الاتصالات = Telecommunications (BKTEL) | المواد الأساسية = Basic Materials (BKBM) | الرعاية الصحية = Health Care (BKHC) | السلع الاستهلاكية = Consumer Staples (BKCS) | التكنولوجيا = Technology (BKTECH) | المنافع = Utilities (BKU)
Hovering over any Arabic index name shows its English name.
LIMITATIONS
- Stock counts per sector are fixed in the code (Boursa Kuwait stock screener, 29 Sep 2026, 137 stocks). They do not update automatically when companies list or delist; they will be revised in script updates. Counts are not shown for BKP and BKM.
- Values on the current, unfinished bar update in real time and are final only after the bar closes.
- On non-standard multiples (for example 2D or 2W) the header shows the timeframe code instead of a period name.
- Values depend on the availability of the KSE index symbols on TradingView; a missing value is shown as "—".
- RS vs BKA is a simple difference in percentage points, not a ratio-based relative strength line.
- Sectors with very few stocks (Technology and Utilities have one stock each) can show large moves driven by a single company.
- The script displays information only. It does not generate trading signals and is not investment advice.
OVERVIEW
A compact table that shows the performance of the 13 Boursa Kuwait sector indices alongside the three market indices (All Share BKA, Premier Market BKP, Main Market BKM) in a single view. It is designed for traders who follow sector rotation in the Kuwaiti market and want to see at a glance which sectors are leading or lagging the overall market.
WHAT IT ADDS
- All Boursa Kuwait sector and market indices in one sortable table, on any chart symbol.
- The comparison period follows the chart timeframe, so one script covers daily, weekly, monthly, quarterly and yearly views.
- Relative change versus the All Share Index (BKA) for every sector.
- The number of listed stocks per sector, to put each move in context: a one-stock sector behaves very differently from a 44-stock sector.
- A native right-to-left Arabic layout, with a full English mode.
HOW IT WORKS
- For each index, the script requests the current and previous close on the chart timeframe and calculates: (close / previous close - 1) x 100.
- Daily chart = daily change, weekly = weekly, monthly = monthly, 3M = quarterly, 12M = yearly. On intraday charts the table shows the daily change. The column header names the active period.
- RS vs BKA = sector change minus BKA change on the same timeframe, in percentage points. Positive means the sector outperformed the market over that period. The same value appears as a tooltip when hovering over each change cell; it can also be shown as a separate column.
- Sectors can be sorted by change, by RS vs BKA, or by number of stocks, ascending or descending. Sectors with no data are always placed at the bottom.
HOW TO USE
Add the script to any chart; it does not depend on the chart symbol. Change the chart timeframe to change the comparison period. Sort by change or RS vs BKA to see which sectors are outperforming or underperforming the market.
SETTINGS
- Language: Arabic (default, right-to-left layout) or English.
- Sort By and direction; Market Rows on/off; Ticker and Stocks columns on/off; RS vs BKA column on/off.
- Position, Top Offset (empty rows so the table does not cover the chart buttons), Text Size.
- Theme: Auto (follows the chart background), Dark, Light, or Custom colours. Up / Down / Flat colours apply in every theme.
ARABIC INTERFACE - ENGLISH TRANSLATIONS
Headers: الرمز = Ticker | المؤشر = Index | الأسهم = Stocks | مقابل العام = vs BKA | يومي = Daily | أسبوعي = Weekly | شهري = Monthly | ربعي = Quarterly | سنوي = Yearly
Markets: السوق العام = All Share (BKA) | السوق الأول = Premier Market (BKP) | السوق الرئيسي = Main Market (BKM)
Sectors: البنوك = Banks (BKB) | الخدمات المالية = Financial Services (BKFS) | العقار = Real Estate (BKRE) | الصناعية = Industrials (BKI) | الخدمات الاستهلاكية = Consumer Discretionary (BKCD) | التأمين = Insurance (BKINS) | الطاقة = Energy (BKE) | الاتصالات = Telecommunications (BKTEL) | المواد الأساسية = Basic Materials (BKBM) | الرعاية الصحية = Health Care (BKHC) | السلع الاستهلاكية = Consumer Staples (BKCS) | التكنولوجيا = Technology (BKTECH) | المنافع = Utilities (BKU)
Hovering over any Arabic index name shows its English name.
LIMITATIONS
- Stock counts per sector are fixed in the code (Boursa Kuwait stock screener, 29 Sep 2026, 137 stocks). They do not update automatically when companies list or delist; they will be revised in script updates. Counts are not shown for BKP and BKM.
- Values on the current, unfinished bar update in real time and are final only after the bar closes.
- On non-standard multiples (for example 2D or 2W) the header shows the timeframe code instead of a period name.
- Values depend on the availability of the KSE index symbols on TradingView; a missing value is shown as "—".
- RS vs BKA is a simple difference in percentage points, not a ratio-based relative strength line.
- Sectors with very few stocks (Technology and Utilities have one stock each) can show large moves driven by a single company.
- The script displays information only. It does not generate trading signals and is not investment advice.

Haftungsausschluss
Die Informationen und Veröffentlichungen sind nicht als Finanz-, Anlage-, Handels- oder andere Arten von Ratschlägen oder Empfehlungen gedacht, die von TradingView bereitgestellt oder gebilligt werden, und stellen diese nicht dar. Lesen Sie mehr in den Nutzungsbedingungen.
Haftungsausschluss
Die Informationen und Veröffentlichungen sind nicht als Finanz-, Anlage-, Handels- oder andere Arten von Ratschlägen oder Empfehlungen gedacht, die von TradingView bereitgestellt oder gebilligt werden, und stellen diese nicht dar. Lesen Sie mehr in den Nutzungsbedingungen.