OPEN-SOURCE SCRIPT
Macro Regime: Market mood + Regime detector
1. The Core Idea
Everything in this indicator is just measuring that preference, then checking whether fear is rising fast enough to matter.
2. The Engine: SPHB / SPLV
What these ETFs represent
SPHB = high-beta stocks (move more than the market)
SPLV = low-volatility stocks (move less than the market)
What the ratio means
This ratio is your risk appetite heartbeat.
3. Trend Filters (Separating Noise from Regimes)
The moving averages
How they’re used
This avoids reacting to every wiggle.
4. RSI: Detecting Overconfidence & Exhaustion
Why RSI is applied to the ratio
You’re not asking “are stocks overbought?”
You’re asking: “Is risk preference itself becoming stretched?”
Interpretation
RSI helps separate:
Healthy expansion from Speculative euphoria
5. Stress Filter: Volatility (VIX or VIXY/SPY)
Why this matters
Risk can fall in two very different ways:
The stress filter answers: “Is fear becoming systemic?”
How it’s measured
Either VIX, or VIXY / SPY (volatility vs equities)
Converted into a Z-score so spikes stand out clearly.
Interpretation
6. Credit & Breadth (Confirmation, Not Drivers)
These don’t create signals — they confirm them.
Credit: HYG / TLT
Breadth: RSP / SPY
If high beta weakens + credit & breadth roll, regime shifts are far more reliable.
7. The Four Regimes (This Is the Payoff)
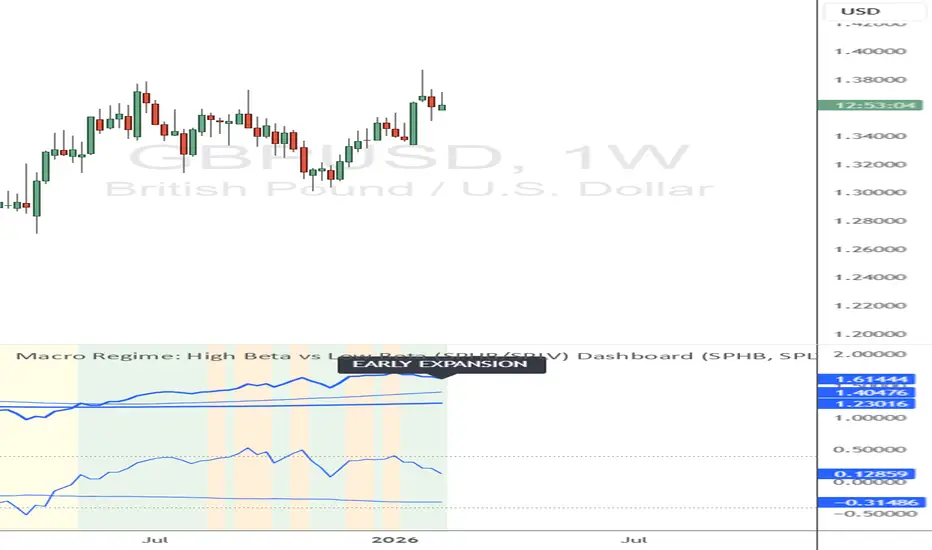
🟢 Early Expansion
What’s happening:
On the chart
How to think: “Risk is being rewarded.”
🟡 Late Cycle / Euphoria
What’s happening
On the chart
How to think: “Upside exists, but fragility is building.”
🟠 Slowdown
What’s happening
On the chart
How to think: “Protect gains, reduce beta.”
🔴 Crisis
What’s happening
On the chart
How to think: “Capital preservation > return.”
8. Binary Mode: Risk-ON vs Risk-OFF
The script also simplifies everything into a single switch:
Risk-ON
Risk-OFF
This is what you’d use for:
- When investors feel confident, they buy high-beta stocks.
*When they feel nervous, they hide in low-volatility stocks.
Everything in this indicator is just measuring that preference, then checking whether fear is rising fast enough to matter.
2. The Engine: SPHB / SPLV
What these ETFs represent
SPHB = high-beta stocks (move more than the market)
SPLV = low-volatility stocks (move less than the market)
What the ratio means
- SPHB / SPLV rising → investors prefer risk
- SPHB / SPLV falling → investors prefer safety
This ratio is your risk appetite heartbeat.
3. Trend Filters (Separating Noise from Regimes)
The moving averages
- Fast MA (50) → short-term risk momentum
- Slow MA (200) → long-term risk regime
How they’re used
- Ratio above the 200 MA → risk-on environment
- Ratio below the 200 MA → risk-off environment
- Fast MA crossing slow MA → regime transition
This avoids reacting to every wiggle.
4. RSI: Detecting Overconfidence & Exhaustion
Why RSI is applied to the ratio
You’re not asking “are stocks overbought?”
You’re asking: “Is risk preference itself becoming stretched?”
Interpretation
- RSI > 70 → investors are crowding into risk
- Lower RSI highs while ratio makes higher highs → enthusiasm is fading (classic late-cycle behavior)
- RSI < 30 → panic / forced de-risking
RSI helps separate:
Healthy expansion from Speculative euphoria
5. Stress Filter: Volatility (VIX or VIXY/SPY)
Why this matters
Risk can fall in two very different ways:
- Orderly slowdown (volatility stays calm)
- Crisis (volatility explodes)
The stress filter answers: “Is fear becoming systemic?”
How it’s measured
Either
VIX, or VIXY / SPY (volatility vs equities)Converted into a Z-score so spikes stand out clearly.
Interpretation
- Low stress → normal market functioning
- High stress → forced selling, margin calls, policy response territory
6. Credit & Breadth (Confirmation, Not Drivers)
These don’t create signals — they confirm them.
Credit: HYG / TLT
- Junk bonds vs Treasuries
- Falling → credit risk rising (often leads equities)
Breadth: RSP / SPY
- Equal-weight vs cap-weight
- Falling → narrowing leadership, fragile market
If high beta weakens + credit & breadth roll, regime shifts are far more reliable.
7. The Four Regimes (This Is the Payoff)
🟢 Early Expansion
What’s happening:
- Investors steadily increase risk
- Credit and breadth cooperate
- Volatility stays muted
On the chart
- SPHB/SPLV above 200 MA
- RSI rising but < 70
- Green background
How to think: “Risk is being rewarded.”
🟡 Late Cycle / Euphoria
What’s happening
- Everyone already owns risk
- Momentum slows under the surface
- Complacency is high
On the chart
- Ratio still rising
- RSI > 70 or divergence
- Orange background
How to think: “Upside exists, but fragility is building.”
🟠 Slowdown
What’s happening
- Investors quietly reduce exposure
- No panic yet
- Often policy-sensitive phase
On the chart
- Ratio below fast MA
- Still above or near slow MA
- Stress remains low
- Yellow background
How to think: “Protect gains, reduce beta.”
🔴 Crisis
What’s happening
- Forced de-risking
- Liquidity stress
- Correlations go to 1
On the chart
- SPHB/SPLV collapses below 200 MA
- RSI < 30
- Stress Z-score spikes
- Red background
How to think: “Capital preservation > return.”
8. Binary Mode: Risk-ON vs Risk-OFF
The script also simplifies everything into a single switch:
Risk-ON
- High beta trending up
- Confirmations OK
- Stress contained
Risk-OFF
- High beta trending down
- Stress elevated
This is what you’d use for:
- Position sizing
- Exposure limits
- Asset rotation
Open-source Skript
Ganz im Sinne von TradingView hat dieser Autor sein/ihr Script als Open-Source veröffentlicht. Auf diese Weise können nun auch andere Trader das Script rezensieren und die Funktionalität überprüfen. Vielen Dank an den Autor! Sie können das Script kostenlos verwenden, aber eine Wiederveröffentlichung des Codes unterliegt unseren Hausregeln.

Live Youtube - youtube.com/@SignalCentre/streams
Haftungsausschluss
Die Informationen und Veröffentlichungen sind nicht als Finanz-, Anlage-, Handels- oder andere Arten von Ratschlägen oder Empfehlungen gedacht, die von TradingView bereitgestellt oder gebilligt werden, und stellen diese nicht dar. Lesen Sie mehr in den Nutzungsbedingungen.
Open-source Skript
Ganz im Sinne von TradingView hat dieser Autor sein/ihr Script als Open-Source veröffentlicht. Auf diese Weise können nun auch andere Trader das Script rezensieren und die Funktionalität überprüfen. Vielen Dank an den Autor! Sie können das Script kostenlos verwenden, aber eine Wiederveröffentlichung des Codes unterliegt unseren Hausregeln.
Live Youtube - youtube.com/@SignalCentre/streams
Haftungsausschluss
Die Informationen und Veröffentlichungen sind nicht als Finanz-, Anlage-, Handels- oder andere Arten von Ratschlägen oder Empfehlungen gedacht, die von TradingView bereitgestellt oder gebilligt werden, und stellen diese nicht dar. Lesen Sie mehr in den Nutzungsbedingungen.