Drawdown Recovery Censoring Audit
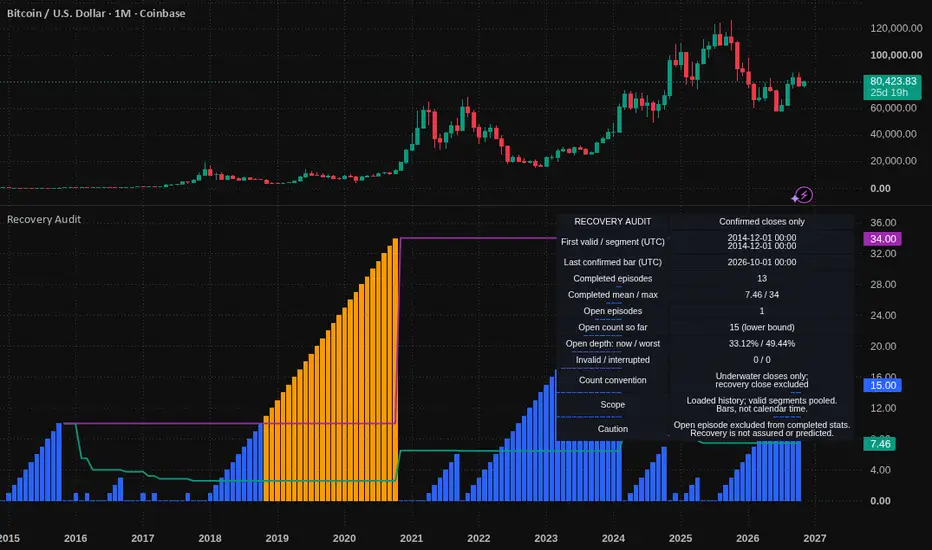
A completed-recovery average answers a narrower question than it may appear to: how long did the episodes that have already recovered stay underwater? An unresolved episode is absent from that average. This indicator keeps that omission visible rather than treating the unresolved episode as if it had recovered.
CONTRIBUTION
The contribution is separate accounting for completed, currently open, and data-interrupted episodes, rather than a trading signal or a raw drawdown-only plot.
HOW TO USE
Add the indicator to a standard chart. Enlarge the indicator pane if table rows are clipped in a small chart. Check the first loaded valid bar date and completed-episode count before interpreting the summaries. Compare the unresolved count with the completed-only mean and maximum, while keeping its depth in view. Do not interpret that comparison as recovery timing or a reason to trade. If invalid or interrupted counts are nonzero, review the data-continuity limitation below.
WHAT IT MEASURES
The indicator starts with the first valid confirmed close in the loaded chart history and maintains a running closing-price high. An underwater episode starts when a confirmed close is strictly below that high. It completes when a confirmed close returns to or exceeds the high.
Duration means the number of consecutive underwater closes. The first lower close counts; the recovery close does not. For example, closes of 100, 99, 98, 100 produce one completed episode lasting two underwater closes. This is not elapsed peak-to-recovery time, calendar days, or a count of intrabar touches.
WHAT YOU SEE
Blue columns show the current episode's underwater-close count. They turn orange when that count exceeds the longest completed episode, if any completed episode exists. Teal and purple lines show the completed-only mean and maximum. These comparisons describe the observed sample; they do not signal that recovery is due.
The table keeps the open episode separate, showing its count so far and current/worst close-based depth. An open count is a lower bound on its final underwater-close count if recovery eventually occurs. Completed summaries display N/A until an episode has completed. Zero means no underwater closes on a valid bar, not a zero-duration completed episode.
Depth is the percentage distance below the episode's running close high: 100 × (high-water mark − close) / high-water mark. The worst depth considers closes only, not intrabar lows. It resets when an episode completes. This measures the chart's price path, not account equity, total returns, or a trading strategy.
CONFIRMATION AND DATA
State changes and plotted values use confirmed bars only. The forming bar's plotted values are blank; the table retains the latest confirmed state. The UTC dates in the table identify bar opening times. Intrabar recoveries that do not survive to the close are not counted. Only standard charts are supported.
Missing or nonpositive closes break continuity. The peak and any open episode are reset; an interrupted episode is excluded, not counted as recovered. The next valid close seeds a new segment. Completed statistics from earlier valid segments remain pooled. Cumulative invalid-close and interrupted-episode counts are shown in the table and Data Window. A missing bar absent from the feed cannot be detected by this rule.
The Data Window includes completed count and duration sum, open status, current/worst depth, running close high, valid/invalid close counts, interrupted-episode count, and a validity flag for numerical checks.
LIMITS
The high-water mark is relative to loaded history, not necessarily the instrument's all-time high. Earlier unseen peaks and episodes are unknown. Loading different history, changing timeframe, symbol, session settings, or adjusted data can change the results. Bars are not equal calendar durations. The initial segment is seeded from the first available valid close, even if price was already below an earlier unseen high.
Separating an unresolved episode does not statistically correct censoring or estimate a recovery probability. The episode might never recover. Completed-only means and maxima are descriptive sample statistics, not forecasts or limits on future drawdowns. Educational open-source indicator; no trading signals, alerts, or order logic.
VALIDATION
The Pine v6 indicator was compiled and exercised in TradingView on standard BTCUSD and AAPL charts. Full loaded-history monthly exports were checked against an independent episode-accounting reference: 143 BTCUSD and 551 AAPL confirmed bars, 13 diagnostic fields per bar, with no mismatches. A live BTCUSD one-minute close was checked before and after confirmation and after a chart reload: shared confirmed outputs remained unchanged, and the forming bar remained blank. Synthetic edge-case checks covered equal highs, overshoots, unresolved episodes, invalid closes, and intrabar no-ops. The nonstandard-chart guard was also exercised on Heikin Ashi.
These are implementation checks on the tested data, not proof against all possible feed revisions or changed chart history. The truncated one-minute exports validate transitions and shared-output stability from their first exported state, not earlier hidden-history totals. No trading performance is claimed.
CONTRIBUTION
The contribution is separate accounting for completed, currently open, and data-interrupted episodes, rather than a trading signal or a raw drawdown-only plot.
HOW TO USE
Add the indicator to a standard chart. Enlarge the indicator pane if table rows are clipped in a small chart. Check the first loaded valid bar date and completed-episode count before interpreting the summaries. Compare the unresolved count with the completed-only mean and maximum, while keeping its depth in view. Do not interpret that comparison as recovery timing or a reason to trade. If invalid or interrupted counts are nonzero, review the data-continuity limitation below.
WHAT IT MEASURES
The indicator starts with the first valid confirmed close in the loaded chart history and maintains a running closing-price high. An underwater episode starts when a confirmed close is strictly below that high. It completes when a confirmed close returns to or exceeds the high.
Duration means the number of consecutive underwater closes. The first lower close counts; the recovery close does not. For example, closes of 100, 99, 98, 100 produce one completed episode lasting two underwater closes. This is not elapsed peak-to-recovery time, calendar days, or a count of intrabar touches.
WHAT YOU SEE
Blue columns show the current episode's underwater-close count. They turn orange when that count exceeds the longest completed episode, if any completed episode exists. Teal and purple lines show the completed-only mean and maximum. These comparisons describe the observed sample; they do not signal that recovery is due.
The table keeps the open episode separate, showing its count so far and current/worst close-based depth. An open count is a lower bound on its final underwater-close count if recovery eventually occurs. Completed summaries display N/A until an episode has completed. Zero means no underwater closes on a valid bar, not a zero-duration completed episode.
Depth is the percentage distance below the episode's running close high: 100 × (high-water mark − close) / high-water mark. The worst depth considers closes only, not intrabar lows. It resets when an episode completes. This measures the chart's price path, not account equity, total returns, or a trading strategy.
CONFIRMATION AND DATA
State changes and plotted values use confirmed bars only. The forming bar's plotted values are blank; the table retains the latest confirmed state. The UTC dates in the table identify bar opening times. Intrabar recoveries that do not survive to the close are not counted. Only standard charts are supported.
Missing or nonpositive closes break continuity. The peak and any open episode are reset; an interrupted episode is excluded, not counted as recovered. The next valid close seeds a new segment. Completed statistics from earlier valid segments remain pooled. Cumulative invalid-close and interrupted-episode counts are shown in the table and Data Window. A missing bar absent from the feed cannot be detected by this rule.
The Data Window includes completed count and duration sum, open status, current/worst depth, running close high, valid/invalid close counts, interrupted-episode count, and a validity flag for numerical checks.
LIMITS
The high-water mark is relative to loaded history, not necessarily the instrument's all-time high. Earlier unseen peaks and episodes are unknown. Loading different history, changing timeframe, symbol, session settings, or adjusted data can change the results. Bars are not equal calendar durations. The initial segment is seeded from the first available valid close, even if price was already below an earlier unseen high.
Separating an unresolved episode does not statistically correct censoring or estimate a recovery probability. The episode might never recover. Completed-only means and maxima are descriptive sample statistics, not forecasts or limits on future drawdowns. Educational open-source indicator; no trading signals, alerts, or order logic.
VALIDATION
The Pine v6 indicator was compiled and exercised in TradingView on standard BTCUSD and AAPL charts. Full loaded-history monthly exports were checked against an independent episode-accounting reference: 143 BTCUSD and 551 AAPL confirmed bars, 13 diagnostic fields per bar, with no mismatches. A live BTCUSD one-minute close was checked before and after confirmation and after a chart reload: shared confirmed outputs remained unchanged, and the forming bar remained blank. Synthetic edge-case checks covered equal highs, overshoots, unresolved episodes, invalid closes, and intrabar no-ops. The nonstandard-chart guard was also exercised on Heikin Ashi.
These are implementation checks on the tested data, not proof against all possible feed revisions or changed chart history. The truncated one-minute exports validate transitions and shared-output stability from their first exported state, not earlier hidden-history totals. No trading performance is claimed.

Haftungsausschluss
Die Informationen und Veröffentlichungen sind nicht als Finanz-, Anlage-, Handels- oder andere Arten von Ratschlägen oder Empfehlungen gedacht, die von TradingView bereitgestellt oder gebilligt werden, und stellen diese nicht dar. Lesen Sie mehr in den Nutzungsbedingungen.
Haftungsausschluss
Die Informationen und Veröffentlichungen sind nicht als Finanz-, Anlage-, Handels- oder andere Arten von Ratschlägen oder Empfehlungen gedacht, die von TradingView bereitgestellt oder gebilligt werden, und stellen diese nicht dar. Lesen Sie mehr in den Nutzungsbedingungen.