Price Impact Efficiency [IEF]
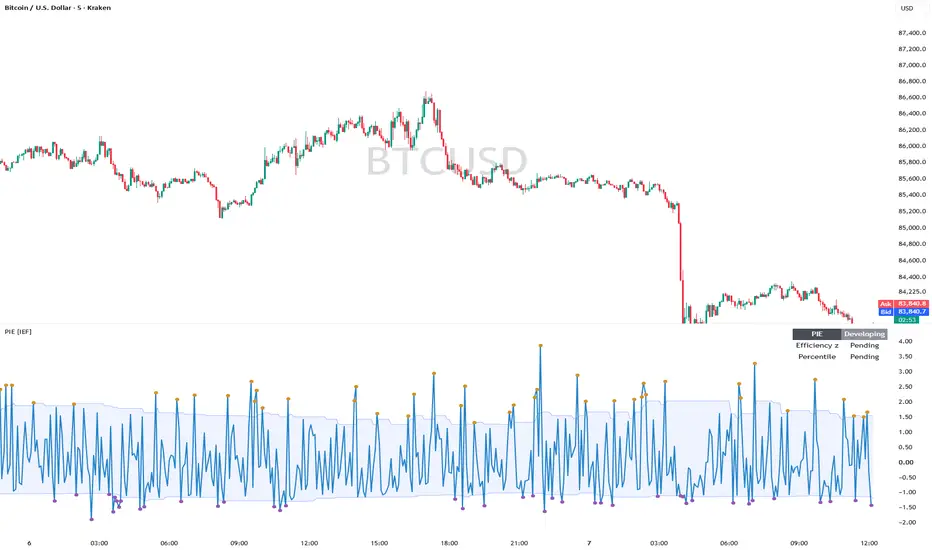
Price Impact Efficiency (PIE) measures absolute price movement relative to volume participation. It presents that relationship as a continuous line with a historical percentile envelope.
CALCULATION
Current absolute close-to-close movement is divided by the prior bar's ATR. Current volume is divided by the mean volume of prior bars. The movement measure is then divided by relative volume, with a configurable volume floor to avoid unstable ratios at very small readings.
The ratio is transformed using log(1 + ratio), which handles zero price movement, then standardized against the mean and standard deviation of prior transformed ratios. Positive scores indicate a larger response per unit of relative volume than the recent baseline; negative scores indicate a smaller response. Zero is the prior transformed-ratio mean, not zero price movement. This is a descriptive ratio, not a causal estimate of market impact.
DISPLAY AND USE
The blue line shows the standardized score. The shaded band shows the 10th and 90th percentiles of prior standardized scores. Amber dots mark scores above this envelope; purple dots mark scores below it. Dot colors describe position within the historical distribution, not bullish or bearish direction.
The compact readout shows the score and the current transformed ratio's percentile rank. Its rank window includes the current observation; the envelope uses prior standardized scores, so the two percentile references differ.
Apply the study to a standard candle chart with volume data and compare readings within the same symbol and timeframe. Use it to examine whether observed price response per relative participation is high or low compared with recent history. Neither condition identifies absorption, exhaustion, participant identity, or a future reversal.
INPUTS AND ALERTS
Prior baseline length (default 30) controls both the prior volume mean and the prior efficiency statistics. ATR length defaults to 14. Percentile lookback defaults to 100. Relative-volume floor defaults to 0.10. Short history produces a warm-up period, and the percentile envelope takes longer to initialize than the main score.
Bar-close confirmation is enabled by default. The developing bar has no confirmed score or dot and its readout remains Pending. Disabling confirmation allows values to change during the open bar. Alerts describe scores at or above +1.5 or at or below -1.5; these fixed alert thresholds are separate from the adaptive percentile envelope.
WHY A SEPARATE PUBLICATION
My Volume-Range Context Classifier assigns discrete bar conditions using volume, range, close location and structure. Normalized Volume Dynamics focuses on time-of-day volume normalization. PIE instead studies a continuous ratio of ATR-normalized close movement to rolling relative volume, standardizes that ratio, and displays its historical distribution. It preserves this distinct research purpose rather than adding another set of bar classifications.
LIMITATIONS
The volume, ATR and standardization references exclude the current bar. Bars with missing or zero volume are excluded. Very small volume is floored, which changes the ratio at that boundary. A constant valid ratio history receives a neutral score when its standard deviation is zero. ATR-normalized close movement can include gaps and is not intrabar range or order-flow imbalance.
Volume quality differs across markets; tick volume represents activity rather than centralized traded volume. Baselines are rolling and do not correct for time-of-day seasonality. Scores depend on chart history, symbol, timeframe and inputs. Percentiles describe the sampled history rather than probabilities of future outcomes. Historical values may change if the data provider revises data. The study makes no performance or predictive accuracy claims.
The Pine v6 source is published under Mozilla Public License 2.0. Intended for education, chart context and research.
CALCULATION
Current absolute close-to-close movement is divided by the prior bar's ATR. Current volume is divided by the mean volume of prior bars. The movement measure is then divided by relative volume, with a configurable volume floor to avoid unstable ratios at very small readings.
The ratio is transformed using log(1 + ratio), which handles zero price movement, then standardized against the mean and standard deviation of prior transformed ratios. Positive scores indicate a larger response per unit of relative volume than the recent baseline; negative scores indicate a smaller response. Zero is the prior transformed-ratio mean, not zero price movement. This is a descriptive ratio, not a causal estimate of market impact.
DISPLAY AND USE
The blue line shows the standardized score. The shaded band shows the 10th and 90th percentiles of prior standardized scores. Amber dots mark scores above this envelope; purple dots mark scores below it. Dot colors describe position within the historical distribution, not bullish or bearish direction.
The compact readout shows the score and the current transformed ratio's percentile rank. Its rank window includes the current observation; the envelope uses prior standardized scores, so the two percentile references differ.
Apply the study to a standard candle chart with volume data and compare readings within the same symbol and timeframe. Use it to examine whether observed price response per relative participation is high or low compared with recent history. Neither condition identifies absorption, exhaustion, participant identity, or a future reversal.
INPUTS AND ALERTS
Prior baseline length (default 30) controls both the prior volume mean and the prior efficiency statistics. ATR length defaults to 14. Percentile lookback defaults to 100. Relative-volume floor defaults to 0.10. Short history produces a warm-up period, and the percentile envelope takes longer to initialize than the main score.
Bar-close confirmation is enabled by default. The developing bar has no confirmed score or dot and its readout remains Pending. Disabling confirmation allows values to change during the open bar. Alerts describe scores at or above +1.5 or at or below -1.5; these fixed alert thresholds are separate from the adaptive percentile envelope.
WHY A SEPARATE PUBLICATION
My Volume-Range Context Classifier assigns discrete bar conditions using volume, range, close location and structure. Normalized Volume Dynamics focuses on time-of-day volume normalization. PIE instead studies a continuous ratio of ATR-normalized close movement to rolling relative volume, standardizes that ratio, and displays its historical distribution. It preserves this distinct research purpose rather than adding another set of bar classifications.
LIMITATIONS
The volume, ATR and standardization references exclude the current bar. Bars with missing or zero volume are excluded. Very small volume is floored, which changes the ratio at that boundary. A constant valid ratio history receives a neutral score when its standard deviation is zero. ATR-normalized close movement can include gaps and is not intrabar range or order-flow imbalance.
Volume quality differs across markets; tick volume represents activity rather than centralized traded volume. Baselines are rolling and do not correct for time-of-day seasonality. Scores depend on chart history, symbol, timeframe and inputs. Percentiles describe the sampled history rather than probabilities of future outcomes. Historical values may change if the data provider revises data. The study makes no performance or predictive accuracy claims.
The Pine v6 source is published under Mozilla Public License 2.0. Intended for education, chart context and research.

— IndicatorEliteFlow
No hype. Just data.
No hype. Just data.
Haftungsausschluss
Die Informationen und Veröffentlichungen sind nicht als Finanz-, Anlage-, Handels- oder andere Arten von Ratschlägen oder Empfehlungen gedacht, die von TradingView bereitgestellt oder gebilligt werden, und stellen diese nicht dar. Lesen Sie mehr in den Nutzungsbedingungen.
— IndicatorEliteFlow
No hype. Just data.
No hype. Just data.
Haftungsausschluss
Die Informationen und Veröffentlichungen sind nicht als Finanz-, Anlage-, Handels- oder andere Arten von Ratschlägen oder Empfehlungen gedacht, die von TradingView bereitgestellt oder gebilligt werden, und stellen diese nicht dar. Lesen Sie mehr in den Nutzungsbedingungen.