Daily ATR Percentage Reached - Enhanced
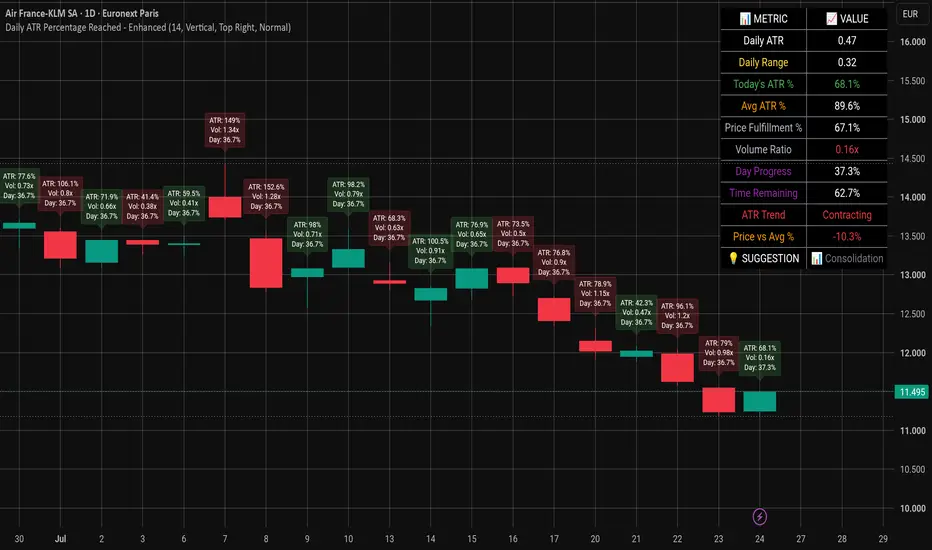
📊 Daily ATR Percentage Reached - Enhanced Indicator
Trading Tool for Volatility Analysis
. 📌 Overview
What is the Daily ATR Percentage Reached Indicator?
A comprehensive volatility analysis tool that measures how much of the daily Average True Range (ATR) has been fulfilled by the current day's price movement.
Core Concept
"Know exactly where price stands within today's expected volatility range"
The Problem It Solves
❌ Trading without context of daily volatility
❌ Missing breakout/breakdown opportunities
❌ Poor stop loss placement
❌ Not knowing when moves are exhausted
The Solution
✅ Real-time volatility context
✅ Clear visual signals on chart
✅ Comprehensive dashboard with key metrics
✅ Actionable trading suggestions
⭐ Key Features
🎯 Core Functionality
Feature Description
Fixed Daily ATR ATR value stays constant throughout the trading day
Multi-Timeframe Compatible Works on any timeframe (1min to Monthly)
Real-time Price Updates Price fulfillment updates on lower timeframes
Visual Labels ATR % displayed directly on the price chart
Separate Indicator Pane Histogram shows ATR % history
📊 Advanced Metrics
Metric What It Shows
ATR % Reached Percentage of daily ATR already used
Price Fulfillment % Current price position within ATR range
Volume Ratio Current volume vs 20-day average
Day Progress Percentage of trading day completed
ATR Trend Whether ATR is expanding or contracting
Price vs Average % Price deviation from 20-day average
📊 Dashboard Metrics
Complete Dashboard Breakdown
# Metric Label Color Interpretation
1 Daily ATR White Current day's ATR value
2 Daily Range Yellow Today's high-low range
3 Today's ATR % Green/Red/Gray % of ATR used today
4 Avg ATR % Orange 50-day average ATR %
5 Price Fulfillment % Blue Price position in ATR
6 Volume Ratio Cyan Volume vs average
7 Day Progress Purple Time elapsed today
8 Time Remaining Purple Time left today
9 ATR Trend Green/Red Expanding/Contracting
10 Price vs Avg % Green/Red/Gray Deviation from average
11 💡 Suggestion Color-coded Trading recommendation
💰 Trading Applications
Entry Signals
Scenario Signal Action
Low ATR % + Bullish Room to run Consider long entry
Low ATR % + Bearish Room to fall Consider short entry
High ATR % + Bullish Exhaustion Consider taking profits
High ATR % + Bearish Exhaustion Consider taking profits
Exit Signals
Metric Signal Action
ATR % > 100% Extended move Tighten stops
ATR % > 150% Extreme move Consider exit
Price Fulfillment > 80% Near top Take partial profits
Price Fulfillment < 20% Near bottom Look for bounce
🕐 Use Cases by Timeframe
🟢 1-Minute Chart (Scalping)
Best For: Quick entries/exits
Monitor Price Fulfillment % in real-time
Enter when fulfillment < 20% with momentum
Exit when fulfillment > 80%
🟡 5-Minute Chart (Day Trading)
Best For: Intraday swing trades
Watch for breakouts when ATR % < 50%
Volume confirmation with Volume Ratio > 1.5x
Use ATR for stop placement
🟠 15-Minute Chart (Swing Trading)
Best For: Multi-hour positions
ATR Trend (Expanding) = Volatility increasing
Price vs Avg % for trend strength
Day Progress to know time left
🔴 1-Hour Chart (Position Trading)
Best For: Full-day positions
Daily context for larger moves
ATR % to gauge daily potential
Volume confirmation
⚠️ Alert System
Built-in Alerts
Alert Trigger Message
ATR Exceeded 100% dailyATRReached > 100 "Daily ATR has exceeded 100%!"
ATR Exceeded 150% dailyATRReached > 150 "Extreme volatility detected!"
High Volume volumeRatio > 2 "Volume is 2x above average!"
🎯 Benefits for Traders
🚀 For Day Traders
Benefit Impact
Real-time Context Know if moves are significant
Volume Confirmation Validate breakouts
Time Awareness Know if there's time left
Stop Placement Use ATR for stops
📈 For Swing Traders
Benefit Impact
Volatility Trend ATR expanding = good for swings
Daily Context Know the day's potential
Support/Resistance Price fulfillment levels
Trend Strength Price vs Average %
💼 For Position Traders
Benefit Impact
Daily View Understand daily volatility
Risk Management ATR-based sizing
Entry Timing Wait for pullbacks
Exit Planning Take profits near extremes
🎓 For Beginners
Benefit Impact
Visual Clarity Easy to understand labels
Dashboard All metrics in one place
Suggestions Built-in trading ideas
Customizable Show only what you need
🔒 Risk Disclaimer
⚠️ Important Notice
This indicator is a tool for analysis, not a guarantee of results. Always:
Use proper risk management
Consider market conditions
Combine with other analysis methods
Never risk more than you can afford to lose
Backtest before live trading
ONLY FOR EDUCATIONAL PURPOSES
NOT A FINANCIAL ADVICE

Haftungsausschluss
Die Informationen und Veröffentlichungen sind nicht als Finanz-, Anlage-, Handels- oder andere Arten von Ratschlägen oder Empfehlungen gedacht, die von TradingView bereitgestellt oder gebilligt werden, und stellen diese nicht dar. Lesen Sie mehr in den Nutzungsbedingungen.
Haftungsausschluss
Die Informationen und Veröffentlichungen sind nicht als Finanz-, Anlage-, Handels- oder andere Arten von Ratschlägen oder Empfehlungen gedacht, die von TradingView bereitgestellt oder gebilligt werden, und stellen diese nicht dar. Lesen Sie mehr in den Nutzungsbedingungen.