ATR Range
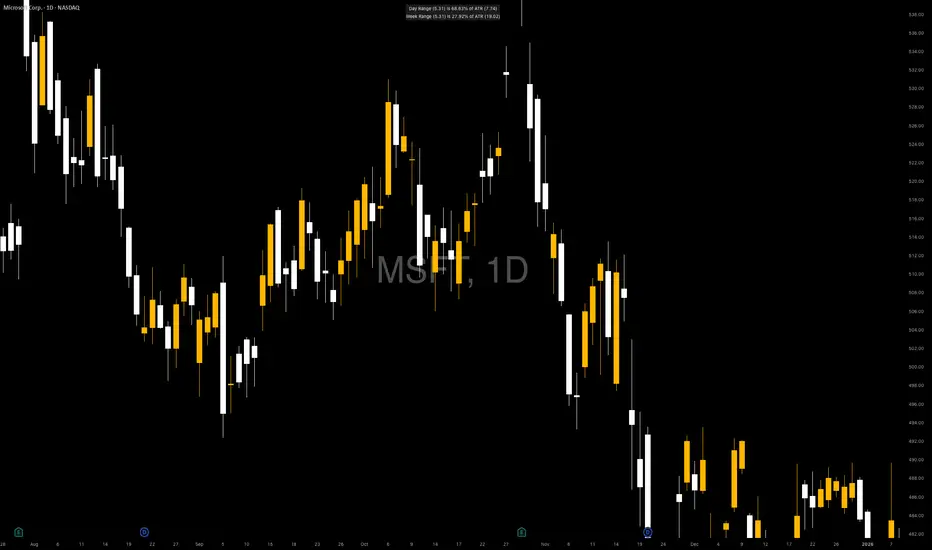
ATR Range is a minimal, clean volatility context indicator designed to show how much of the Daily and Weekly ATR has already been used — without cluttering your chart.
Instead of plotting multiple lines or tables, this indicator displays two simple, highly-informative lines:
• Day Range (X) is Y% of ATR (Z)
• Week Range (X) is Y% of ATR (Z)
These lines update intraday and give you immediate awareness of whether price has already made an average move or still has room to expand.
⸻
🔍 What It Shows
• Daily range vs Daily ATR
• Weekly range vs Weekly ATR
• Percentage of ATR already consumed
⸻
🎯 Why This Is Useful
• Helps avoid chasing extended moves
• Adds volatility context to entries and exits
• Ideal for futures, options, and index trading
Instead of plotting multiple lines or tables, this indicator displays two simple, highly-informative lines:
• Day Range (X) is Y% of ATR (Z)
• Week Range (X) is Y% of ATR (Z)
These lines update intraday and give you immediate awareness of whether price has already made an average move or still has room to expand.
⸻
🔍 What It Shows
• Daily range vs Daily ATR
• Weekly range vs Weekly ATR
• Percentage of ATR already consumed
⸻
🎯 Why This Is Useful
• Helps avoid chasing extended moves
• Adds volatility context to entries and exits
• Ideal for futures, options, and index trading

Haftungsausschluss
Die Informationen und Veröffentlichungen sind nicht als Finanz-, Anlage-, Handels- oder andere Arten von Ratschlägen oder Empfehlungen gedacht, die von TradingView bereitgestellt oder gebilligt werden, und stellen diese nicht dar. Lesen Sie mehr in den Nutzungsbedingungen.
Haftungsausschluss
Die Informationen und Veröffentlichungen sind nicht als Finanz-, Anlage-, Handels- oder andere Arten von Ratschlägen oder Empfehlungen gedacht, die von TradingView bereitgestellt oder gebilligt werden, und stellen diese nicht dar. Lesen Sie mehr in den Nutzungsbedingungen.