OPEN-SOURCE SCRIPT
Intraday Bias Engine
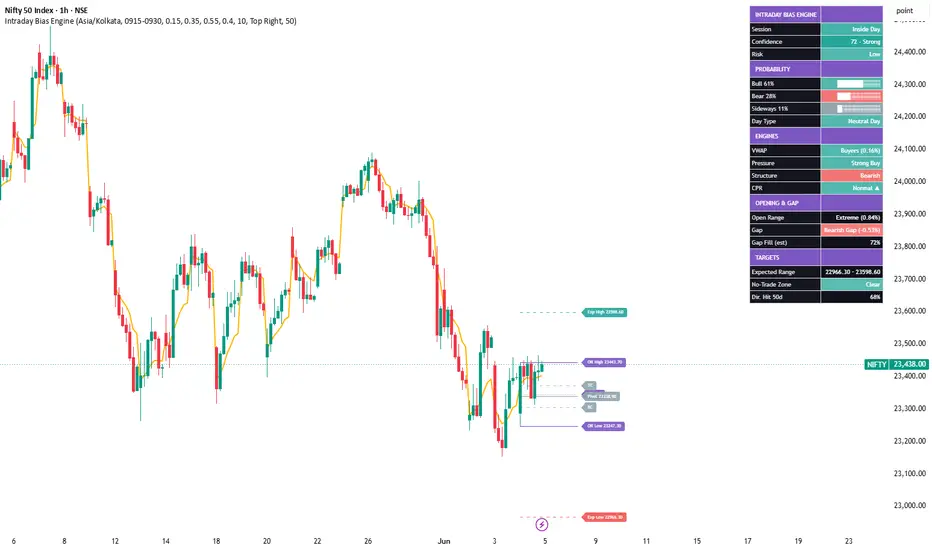
Intraday Bias Engine
OVERVIEW
A probability-based intraday decision dashboard. After the opening auction it
estimates the highest-probability scenario for the session (bullish, bearish or
sideways), the likely day-type, an expected range and a confidence grade - by
combining several classic intraday models into one read. It is a context and
decision-support tool, not a buy/sell signal generator.
WHAT IT COMBINES
- Opening Range: high/low/mid, width vs the day's ATR, classified Narrow / Normal
/ Wide / Extreme.
- Gap: size and direction vs the previous close, with a transparent gap-fill
estimate (smaller gaps tend to fill more often).
- CPR: pivot, TC, BC, width classification and directional bias.
- VWAP: position, distance and who is in control.
- Market structure: higher-high / higher-low vs lower-high / lower-low.
- Smart-money pressure: a 0-100 score from a volume-delta approximation, relative
volume, range expansion, momentum and VWAP distance.
- Directional probability: a weighted blend of the above, normalised so Bull,
Bear and Sideways always total 100%.
- Day-type, expected range, confidence grade and a basic risk read.
DASHBOARD
A movable panel shows session classification, confidence and grade, Bull/Bear/
Sideways probability meters, the individual engine reads, opening-range and gap
context, the expected range, a no-trade (compression) status and a simple
directional hit-rate over the recent sessions.
ON-CHART
Opening Range, CPR (P/TC/BC), VWAP and expected-range bands are drawn for the
current day only. Compression conditions are highlighted as a faint no-trade zone.
HOW TO USE
1. Use an intraday timeframe on a symbol with reliable volume.
2. The read finalises after the opening-range window closes.
3. Favour setups that agree with the dominant probability and a higher confidence
grade; stand aside when the no-trade zone is active.
4. Treat the levels and probabilities as context for your own plan and risk
management.
NOTES
- Daily anchors use confirmed prior sessions; current-day levels draw forward
only and do not repaint historical bars. The live read updates as the day
develops, which is expected for an intraday model.
- The gap-fill figure and the directional hit-rate are simple estimates, not
performance guarantees.
- This script is for research and education only and is not financial advice.
OVERVIEW
A probability-based intraday decision dashboard. After the opening auction it
estimates the highest-probability scenario for the session (bullish, bearish or
sideways), the likely day-type, an expected range and a confidence grade - by
combining several classic intraday models into one read. It is a context and
decision-support tool, not a buy/sell signal generator.
WHAT IT COMBINES
- Opening Range: high/low/mid, width vs the day's ATR, classified Narrow / Normal
/ Wide / Extreme.
- Gap: size and direction vs the previous close, with a transparent gap-fill
estimate (smaller gaps tend to fill more often).
- CPR: pivot, TC, BC, width classification and directional bias.
- VWAP: position, distance and who is in control.
- Market structure: higher-high / higher-low vs lower-high / lower-low.
- Smart-money pressure: a 0-100 score from a volume-delta approximation, relative
volume, range expansion, momentum and VWAP distance.
- Directional probability: a weighted blend of the above, normalised so Bull,
Bear and Sideways always total 100%.
- Day-type, expected range, confidence grade and a basic risk read.
DASHBOARD
A movable panel shows session classification, confidence and grade, Bull/Bear/
Sideways probability meters, the individual engine reads, opening-range and gap
context, the expected range, a no-trade (compression) status and a simple
directional hit-rate over the recent sessions.
ON-CHART
Opening Range, CPR (P/TC/BC), VWAP and expected-range bands are drawn for the
current day only. Compression conditions are highlighted as a faint no-trade zone.
HOW TO USE
1. Use an intraday timeframe on a symbol with reliable volume.
2. The read finalises after the opening-range window closes.
3. Favour setups that agree with the dominant probability and a higher confidence
grade; stand aside when the no-trade zone is active.
4. Treat the levels and probabilities as context for your own plan and risk
management.
NOTES
- Daily anchors use confirmed prior sessions; current-day levels draw forward
only and do not repaint historical bars. The live read updates as the day
develops, which is expected for an intraday model.
- The gap-fill figure and the directional hit-rate are simple estimates, not
performance guarantees.
- This script is for research and education only and is not financial advice.
Open-source Skript
Ganz im Sinne von TradingView hat dieser Autor sein/ihr Script als Open-Source veröffentlicht. Auf diese Weise können nun auch andere Trader das Script rezensieren und die Funktionalität überprüfen. Vielen Dank an den Autor! Sie können das Script kostenlos verwenden, aber eine Wiederveröffentlichung des Codes unterliegt unseren Hausregeln.

Haftungsausschluss
Die Informationen und Veröffentlichungen sind nicht als Finanz-, Anlage-, Handels- oder andere Arten von Ratschlägen oder Empfehlungen gedacht, die von TradingView bereitgestellt oder gebilligt werden, und stellen diese nicht dar. Lesen Sie mehr in den Nutzungsbedingungen.
Open-source Skript
Ganz im Sinne von TradingView hat dieser Autor sein/ihr Script als Open-Source veröffentlicht. Auf diese Weise können nun auch andere Trader das Script rezensieren und die Funktionalität überprüfen. Vielen Dank an den Autor! Sie können das Script kostenlos verwenden, aber eine Wiederveröffentlichung des Codes unterliegt unseren Hausregeln.
Haftungsausschluss
Die Informationen und Veröffentlichungen sind nicht als Finanz-, Anlage-, Handels- oder andere Arten von Ratschlägen oder Empfehlungen gedacht, die von TradingView bereitgestellt oder gebilligt werden, und stellen diese nicht dar. Lesen Sie mehr in den Nutzungsbedingungen.