OPEN-SOURCE SCRIPT
Aktualisiert NYSE Open 30s Range
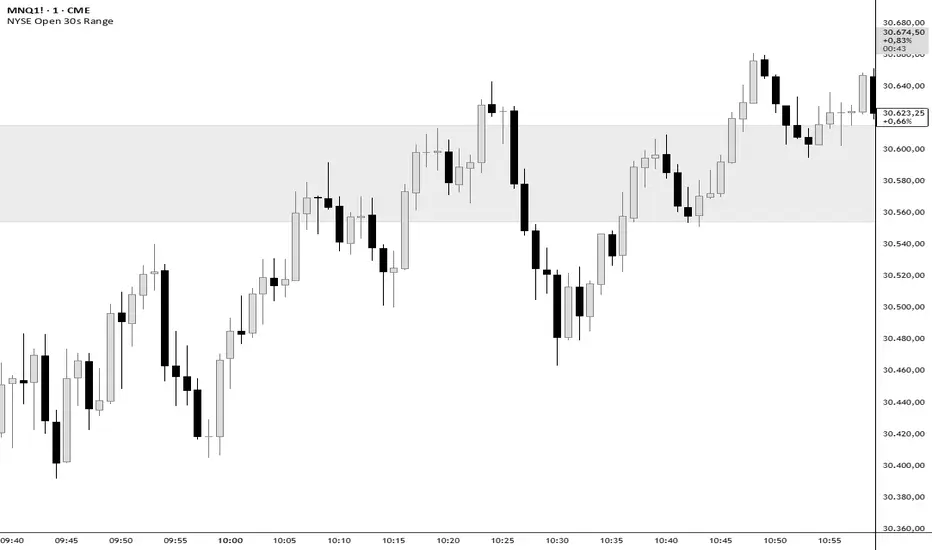
NYSE Opening Range (First 30s Candle)
This indicator automatically plots the NYSE Opening Range based exclusively on the first 30-second candle after the official market open (09:30:00 → 09:30:30 New York time).
The rectangle is drawn using the actual High and Low of that 30-second candle, remaining anchored to the correct opening timestamp regardless of the chart timeframe.
Features
✓ Automatically captures the first 30-second candle of the NYSE open
✓ Rectangle anchored to the actual opening time (does not shift when changing timeframes)
✓ Custom fill color
✓ Adjustable transparency
✓ Custom border color
✓ Multiple border styles (solid, dashed, dotted)
✓ Adjustable border thickness
✓ Adjustable horizontal extension of the range
How to Use
Wait for the first 30-second opening candle to form.
Use the range as a reference for:
Opening breakout setups
Opening rejection setups
Initial market liquidity
Intraday continuation or reversal scenarios
Notes:
The indicator uses internal 30-second data, allowing it to work even on higher chart timeframes.
Time is fixed to America/New_York to maintain alignment with the official NYSE opening session.
This indicator automatically plots the NYSE Opening Range based exclusively on the first 30-second candle after the official market open (09:30:00 → 09:30:30 New York time).
The rectangle is drawn using the actual High and Low of that 30-second candle, remaining anchored to the correct opening timestamp regardless of the chart timeframe.
Features
✓ Automatically captures the first 30-second candle of the NYSE open
✓ Rectangle anchored to the actual opening time (does not shift when changing timeframes)
✓ Custom fill color
✓ Adjustable transparency
✓ Custom border color
✓ Multiple border styles (solid, dashed, dotted)
✓ Adjustable border thickness
✓ Adjustable horizontal extension of the range
How to Use
Wait for the first 30-second opening candle to form.
Use the range as a reference for:
Opening breakout setups
Opening rejection setups
Initial market liquidity
Intraday continuation or reversal scenarios
Notes:
The indicator uses internal 30-second data, allowing it to work even on higher chart timeframes.
Time is fixed to America/New_York to maintain alignment with the official NYSE opening session.
Versionshinweise
Indicator updated to english.Open-source Skript
Ganz im Sinne von TradingView hat dieser Autor sein/ihr Script als Open-Source veröffentlicht. Auf diese Weise können nun auch andere Trader das Script rezensieren und die Funktionalität überprüfen. Vielen Dank an den Autor! Sie können das Script kostenlos verwenden, aber eine Wiederveröffentlichung des Codes unterliegt unseren Hausregeln.

Haftungsausschluss
Die Informationen und Veröffentlichungen sind nicht als Finanz-, Anlage-, Handels- oder andere Arten von Ratschlägen oder Empfehlungen gedacht, die von TradingView bereitgestellt oder gebilligt werden, und stellen diese nicht dar. Lesen Sie mehr in den Nutzungsbedingungen.
Open-source Skript
Ganz im Sinne von TradingView hat dieser Autor sein/ihr Script als Open-Source veröffentlicht. Auf diese Weise können nun auch andere Trader das Script rezensieren und die Funktionalität überprüfen. Vielen Dank an den Autor! Sie können das Script kostenlos verwenden, aber eine Wiederveröffentlichung des Codes unterliegt unseren Hausregeln.
Haftungsausschluss
Die Informationen und Veröffentlichungen sind nicht als Finanz-, Anlage-, Handels- oder andere Arten von Ratschlägen oder Empfehlungen gedacht, die von TradingView bereitgestellt oder gebilligt werden, und stellen diese nicht dar. Lesen Sie mehr in den Nutzungsbedingungen.