Aktualisiert
Ziggy Stardust - Statistical ZigZag & Swing Analytics
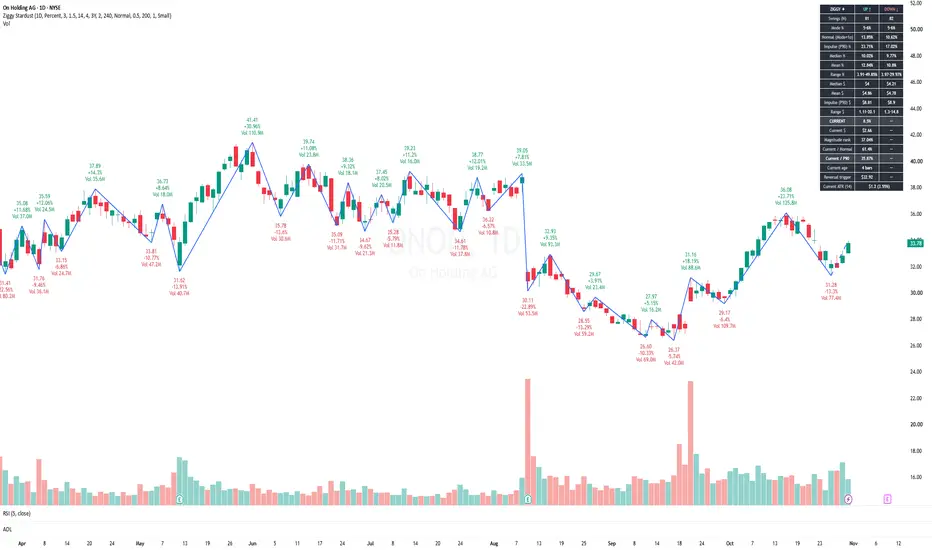
Ziggy Stardust — Statistical ZigZag & Swing Analytics
Every stock has its own personality, how far it typically moves, how deeply it pulls back, how long its swings last, and when its price behavior becomes unusually extended.
Ziggy Stardust helps quantify that personality by combining ZigZag price structure with historical swing distributions to identify typical rotations, unusual extensions, and impulsive moves.
At its core, the indicator attempts to answer a simple question:
How far does this instrument typically move in each direction, and where does the current swing stand relative to its own history?
By analyzing upward and downward swings separately, Ziggy provides statistical context for assessing the current move, recognizing changes in market behavior, and making more informed trade-management decisions.
Inspiration: FuturesTrader71 and Harmonic Rotations
Ziggy Stardust was inspired in part by Morad Askar (FuturesTrader71) and his teachings on harmonic rotations.
Morad uses ZigZag and fractal-based swing analysis on short intraday timeframes, including 1-minute charts, to study the distribution of price rotations. His approach emphasizes understanding what constitutes normal market behavior rather than relying solely on averages or assuming that price movements follow a symmetrical distribution.
I originally learned this methodology through his teaching and have used it in my own futures day trading, including short-timeframe fractal and ZigZag analysis.
One of the ideas that stayed with me is that the size of a rotation communicates information about market behavior.
Most price rotations fall within a relatively typical range. When a rotation becomes unusually large, it may communicate a meaningful change in the aggressiveness of buyers or sellers.
An impulsive rotation can signal directional urgency, increased participation, or a market transitioning into a more directional phase. It's a reason to pay attention.
Over time, I found that the same statistical approach was informative beyond intraday futures trading, particularly when analyzing equities on daily and higher timeframes.
It has become part of my toolbox for understanding the **personality of a stock**: how far it typically moves, how deep its pullbacks tend to be, how long swings last, and when its behavior becomes unusual relative to its own history.
Ziggy Stardust is my independent implementation and extension of these concepts for TradingView.
How It Works
The indicator identifies swing highs and lows using price extremes (highs and lows rather than closing prices), with configurable reversal criteria.
Swings are confirmed when price reverses by a specified percentage or a multiple of Average True Range (ATR), subject to a minimum number of bars required for confirmation.
Confirmed pivots are connected by ZigZag lines, while the developing, unconfirmed swing is displayed separately.
Each completed swing contributes to historical distributions calculated independently for upward and downward rotations.
The indicator supports configurable analysis timeframes and historical study periods, including YTD, 1Y, 3Y, 5Y, and custom date ranges.
Understanding the Statistics
Mode — Most Common Rotation
The mode identifies the most frequently observed range of historical swing sizes.
Rather than looking for identical percentage values, Ziggy groups swings into configurable histogram bins and identifies the most populated interval.
This provides a useful reference for what the instrument most commonly does.
Normal Rotation — Mode + 1 Standard Deviation
Normal Rotation is calculated as the midpoint of the modal interval plus one standard deviation of historical completed swing magnitudes.
It provides a reference for a typical upper range of movement, without requiring the mode and mean to coincide.
Because financial return and swing distributions can be skewed, this is a descriptive statistical reference rather than a guaranteed probability boundary.
Impulse — 90th Percentile (P90)
Impulse represents the empirical 90th percentile of historical completed swing magnitudes.
Approximately 10% of historical swings in the selected sample exceed this threshold.
An impulse is particularly interesting because it may communicate something important about directional aggression.
A move of unusual magnitude might indicate stronger buying or selling urgency, a change in market conditions, or the potential development of a sustained directional trend.
But an impulse can also represent an overextended move that may be vulnerable to a counter-rotation.
Context matters.
Additional Statistics
Ziggy also provides median, mean, minimum and maximum swing sizes, dollar-value distributions, and optional swing-duration statistics.
The current developing swing is compared with completed historical swings of the same direction, including its percentile rank and magnitude relative to the historical P90 threshold.
Practical Applications
I primarily use Ziggy Stardust as a contextual and trade-management tool rather than a standalone entry or exit system.
1. Understanding a Stock's Personality
Different stocks have different volatility characteristics and typical swing structures.
A 10% rotation may be relatively ordinary for one stock but unusually large for another.
Analyzing historical distributions helps establish an instrument-specific reference for assessing current price behavior.
2. Identifying Overextensions
When a developing swing approaches or exceeds its historical impulse threshold, I pay closer attention to the possibility of exhaustion or a counter-rotation.
Depending on the broader technical structure and my existing position, this may inform partial profit-taking, adjustments to risk, or a decision to wait for a better entry location.
3. Recognizing Directional Aggression
An unusually large rotation is not automatically a reason to fade the move.
As emphasized in FuturesTrader71's teaching, an impulse may communicate meaningful directional aggression.
A move that substantially exceeds the instrument's normal rotation size may suggest that the market is behaving differently from its recent history.
This can be a reason to assess potential continuation, the strength of the underlying trend, and whether market participants are accepting prices in the new direction.
4. Adding Context to Pullbacks and Risk Management
Historical downswing distributions can help evaluate whether a pullback remains within the instrument's typical range or has become unusually large.
This information can complement structural support and resistance, trend analysis, volume, and other risk-management considerations.
The statistical boundaries are references, not automatic stop-loss levels.
Features
Important Considerations
Swing confirmation: Confirmed pivot points are drawn at their historical price extremes, but these pivots are not known until the configured reversal conditions have been satisfied. The developing swing can change as new price extremes occur.
Historical distributions: Statistical results depend on the instrument, analysis timeframe, reversal settings, selected study period, and available historical data. Different configurations may produce materially different distributions.
Sample size and market regimes: Historical relationships can change. Statistics calculated from a small number of completed swings may be less representative, and the distribution may evolve as volatility and market conditions change.
Interpretation: Reaching a Normal or Impulse threshold does not establish that a reversal or continuation will occur. An unusually large swing provides information about historical extension, but directional aggression and potential exhaustion should be assessed using additional market context.
Final Thoughts
For me, the value of Ziggy Stardust is not in predicting exactly where a market will turn.
It's in understanding the instrument's historical behavior and recognizing when the market may be communicating something different.
A move that appears large on a chart may be completely normal for that instrument. Conversely, a relatively modest-looking rotation may be statistically unusual.
By studying the distribution of historical swings, we can bring more context to trade selection, position management, and the interpretation of price action.
An impulse is information—not automatically a reversal or continuation signal.
---
Acknowledgment: Special thanks to Morad Askar (FuturesTrader71) for the educational inspiration behind harmonic rotation analysis and the broader Auction Market Theory framework.
Ziggy Stardust is independently developed by AsymmetricLab and is not affiliated with or endorsed by FuturesTrader71.
For educational and research purposes only. Not financial advice.
Every stock has its own personality, how far it typically moves, how deeply it pulls back, how long its swings last, and when its price behavior becomes unusually extended.
Ziggy Stardust helps quantify that personality by combining ZigZag price structure with historical swing distributions to identify typical rotations, unusual extensions, and impulsive moves.
At its core, the indicator attempts to answer a simple question:
How far does this instrument typically move in each direction, and where does the current swing stand relative to its own history?
By analyzing upward and downward swings separately, Ziggy provides statistical context for assessing the current move, recognizing changes in market behavior, and making more informed trade-management decisions.
Inspiration: FuturesTrader71 and Harmonic Rotations
Ziggy Stardust was inspired in part by Morad Askar (FuturesTrader71) and his teachings on harmonic rotations.
Morad uses ZigZag and fractal-based swing analysis on short intraday timeframes, including 1-minute charts, to study the distribution of price rotations. His approach emphasizes understanding what constitutes normal market behavior rather than relying solely on averages or assuming that price movements follow a symmetrical distribution.
I originally learned this methodology through his teaching and have used it in my own futures day trading, including short-timeframe fractal and ZigZag analysis.
One of the ideas that stayed with me is that the size of a rotation communicates information about market behavior.
Most price rotations fall within a relatively typical range. When a rotation becomes unusually large, it may communicate a meaningful change in the aggressiveness of buyers or sellers.
An impulsive rotation can signal directional urgency, increased participation, or a market transitioning into a more directional phase. It's a reason to pay attention.
Over time, I found that the same statistical approach was informative beyond intraday futures trading, particularly when analyzing equities on daily and higher timeframes.
It has become part of my toolbox for understanding the **personality of a stock**: how far it typically moves, how deep its pullbacks tend to be, how long swings last, and when its behavior becomes unusual relative to its own history.
Ziggy Stardust is my independent implementation and extension of these concepts for TradingView.
How It Works
The indicator identifies swing highs and lows using price extremes (highs and lows rather than closing prices), with configurable reversal criteria.
Swings are confirmed when price reverses by a specified percentage or a multiple of Average True Range (ATR), subject to a minimum number of bars required for confirmation.
Confirmed pivots are connected by ZigZag lines, while the developing, unconfirmed swing is displayed separately.
Each completed swing contributes to historical distributions calculated independently for upward and downward rotations.
The indicator supports configurable analysis timeframes and historical study periods, including YTD, 1Y, 3Y, 5Y, and custom date ranges.
Understanding the Statistics
Mode — Most Common Rotation
The mode identifies the most frequently observed range of historical swing sizes.
Rather than looking for identical percentage values, Ziggy groups swings into configurable histogram bins and identifies the most populated interval.
This provides a useful reference for what the instrument most commonly does.
Normal Rotation — Mode + 1 Standard Deviation
Normal Rotation is calculated as the midpoint of the modal interval plus one standard deviation of historical completed swing magnitudes.
It provides a reference for a typical upper range of movement, without requiring the mode and mean to coincide.
Because financial return and swing distributions can be skewed, this is a descriptive statistical reference rather than a guaranteed probability boundary.
Impulse — 90th Percentile (P90)
Impulse represents the empirical 90th percentile of historical completed swing magnitudes.
Approximately 10% of historical swings in the selected sample exceed this threshold.
An impulse is particularly interesting because it may communicate something important about directional aggression.
A move of unusual magnitude might indicate stronger buying or selling urgency, a change in market conditions, or the potential development of a sustained directional trend.
But an impulse can also represent an overextended move that may be vulnerable to a counter-rotation.
Context matters.
Additional Statistics
Ziggy also provides median, mean, minimum and maximum swing sizes, dollar-value distributions, and optional swing-duration statistics.
The current developing swing is compared with completed historical swings of the same direction, including its percentile rank and magnitude relative to the historical P90 threshold.
Practical Applications
I primarily use Ziggy Stardust as a contextual and trade-management tool rather than a standalone entry or exit system.
1. Understanding a Stock's Personality
Different stocks have different volatility characteristics and typical swing structures.
A 10% rotation may be relatively ordinary for one stock but unusually large for another.
Analyzing historical distributions helps establish an instrument-specific reference for assessing current price behavior.
2. Identifying Overextensions
When a developing swing approaches or exceeds its historical impulse threshold, I pay closer attention to the possibility of exhaustion or a counter-rotation.
Depending on the broader technical structure and my existing position, this may inform partial profit-taking, adjustments to risk, or a decision to wait for a better entry location.
3. Recognizing Directional Aggression
An unusually large rotation is not automatically a reason to fade the move.
As emphasized in FuturesTrader71's teaching, an impulse may communicate meaningful directional aggression.
A move that substantially exceeds the instrument's normal rotation size may suggest that the market is behaving differently from its recent history.
This can be a reason to assess potential continuation, the strength of the underlying trend, and whether market participants are accepting prices in the new direction.
4. Adding Context to Pullbacks and Risk Management
Historical downswing distributions can help evaluate whether a pullback remains within the instrument's typical range or has become unusually large.
This information can complement structural support and resistance, trend analysis, volume, and other risk-management considerations.
The statistical boundaries are references, not automatic stop-loss levels.
Features
- High/low-based ZigZag swing detection
- Percentage- or ATR-based reversal criteria
- Separate upward and downward swing distributions
- Historical Mode, Normal Rotation, and Impulse (P90) calculations
- Mean, median, range, and dollar-value statistics
- Current swing magnitude and historical percentile rank
- Optional swing-duration distributions and age percentiles
- Cumulative volume, percentage change, dollar movement, and duration labels
- Developing swing visualization
- Current ATR displayed in price units and percentage terms
- Reversal trigger price
- - Configurable historical study periods and analysis timeframes
- Alerts when developing swings exceed Normal or P90 thresholds
- Customizable statistical table and chart labels
Important Considerations
Swing confirmation: Confirmed pivot points are drawn at their historical price extremes, but these pivots are not known until the configured reversal conditions have been satisfied. The developing swing can change as new price extremes occur.
Historical distributions: Statistical results depend on the instrument, analysis timeframe, reversal settings, selected study period, and available historical data. Different configurations may produce materially different distributions.
Sample size and market regimes: Historical relationships can change. Statistics calculated from a small number of completed swings may be less representative, and the distribution may evolve as volatility and market conditions change.
Interpretation: Reaching a Normal or Impulse threshold does not establish that a reversal or continuation will occur. An unusually large swing provides information about historical extension, but directional aggression and potential exhaustion should be assessed using additional market context.
Final Thoughts
For me, the value of Ziggy Stardust is not in predicting exactly where a market will turn.
It's in understanding the instrument's historical behavior and recognizing when the market may be communicating something different.
A move that appears large on a chart may be completely normal for that instrument. Conversely, a relatively modest-looking rotation may be statistically unusual.
By studying the distribution of historical swings, we can bring more context to trade selection, position management, and the interpretation of price action.
An impulse is information—not automatically a reversal or continuation signal.
---
Acknowledgment: Special thanks to Morad Askar (FuturesTrader71) for the educational inspiration behind harmonic rotation analysis and the broader Auction Market Theory framework.
Ziggy Stardust is independently developed by AsymmetricLab and is not affiliated with or endorsed by FuturesTrader71.
For educational and research purposes only. Not financial advice.
Versionshinweise
Updated the publication chart to provide a cleaner view of Ziggy Stardust's swing detection, historical statistics, and current swing analysis. No changes to indicator calculations or functionality.
Haftungsausschluss
Die Informationen und Veröffentlichungen sind nicht als Finanz-, Anlage-, Handels- oder andere Arten von Ratschlägen oder Empfehlungen gedacht, die von TradingView bereitgestellt oder gebilligt werden, und stellen diese nicht dar. Lesen Sie mehr in den Nutzungsbedingungen.
Haftungsausschluss
Die Informationen und Veröffentlichungen sind nicht als Finanz-, Anlage-, Handels- oder andere Arten von Ratschlägen oder Empfehlungen gedacht, die von TradingView bereitgestellt oder gebilligt werden, und stellen diese nicht dar. Lesen Sie mehr in den Nutzungsbedingungen.