OPEN-SOURCE SCRIPT
MTF Bias Dashboard (TOTAL STRENGTH)
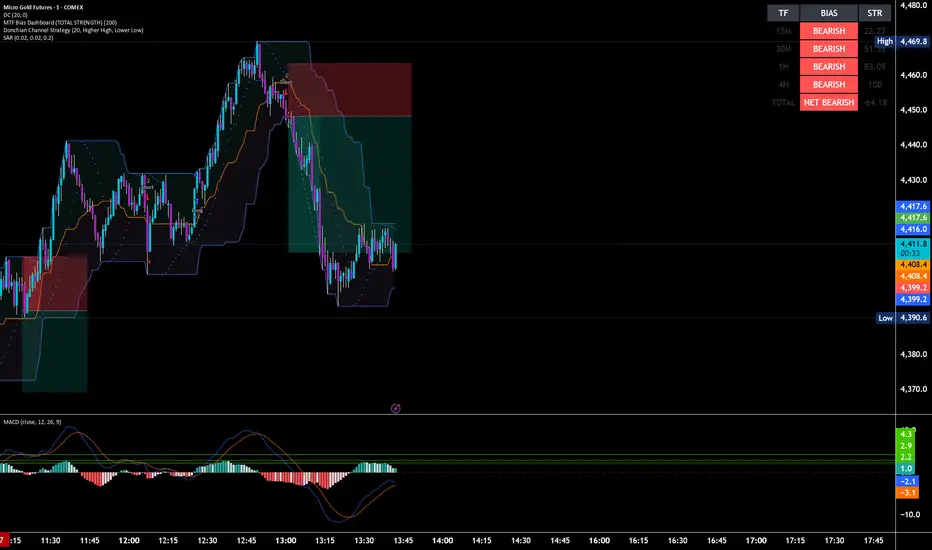
📊 Multi-Timeframe Bias Dashboard (Total Strength)
This indicator gives a clear, no-noise view of market direction by analyzing multiple timeframes and combining them into a single actionable bias.
It tracks the relationship between price and the 200 EMA across key timeframes (15M, 30M, 1H, 4H) to determine whether the market is bullish or bearish, while also measuring the strength of each trend.
🔍 What It Shows
Directional Bias (Bullish / Bearish) for each timeframe
Trend Strength (0–100) based on distance from the 200 EMA
A Total Strength Score that combines all timeframes into one number
This gives you both:
The bigger picture trend
The immediate trading environment
⚡ How It Works
Each timeframe contributes to an overall score:
Bullish trends add positive strength
Bearish trends add negative strength
These values are combined into a Net Strength reading, which tells you who’s in control of the market.
🧠 How to Read It
Strong Positive Total → Market is bullish → Focus on longs
Strong Negative Total → Market is bearish → Focus on shorts
Near Zero → Market is choppy → Avoid trading
Higher timeframe alignment (1H + 4H) defines the main bias, while lower timeframes (15M + 30M) help time entries.
🎯 Why This Is Useful
Eliminates guesswork and conflicting signals
Keeps you trading with trend, not against it
Helps avoid low-quality trades in choppy markets
Perfect for day traders and prop firm traders
🚀 Best Use Case
Use this as a trend filter + bias confirmation tool, then pair it with your entry model (price action, MACD, liquidity, etc.) for precision entries.
This indicator gives a clear, no-noise view of market direction by analyzing multiple timeframes and combining them into a single actionable bias.
It tracks the relationship between price and the 200 EMA across key timeframes (15M, 30M, 1H, 4H) to determine whether the market is bullish or bearish, while also measuring the strength of each trend.
🔍 What It Shows
Directional Bias (Bullish / Bearish) for each timeframe
Trend Strength (0–100) based on distance from the 200 EMA
A Total Strength Score that combines all timeframes into one number
This gives you both:
The bigger picture trend
The immediate trading environment
⚡ How It Works
Each timeframe contributes to an overall score:
Bullish trends add positive strength
Bearish trends add negative strength
These values are combined into a Net Strength reading, which tells you who’s in control of the market.
🧠 How to Read It
Strong Positive Total → Market is bullish → Focus on longs
Strong Negative Total → Market is bearish → Focus on shorts
Near Zero → Market is choppy → Avoid trading
Higher timeframe alignment (1H + 4H) defines the main bias, while lower timeframes (15M + 30M) help time entries.
🎯 Why This Is Useful
Eliminates guesswork and conflicting signals
Keeps you trading with trend, not against it
Helps avoid low-quality trades in choppy markets
Perfect for day traders and prop firm traders
🚀 Best Use Case
Use this as a trend filter + bias confirmation tool, then pair it with your entry model (price action, MACD, liquidity, etc.) for precision entries.
Open-source Skript
Ganz im Sinne von TradingView hat dieser Autor sein/ihr Script als Open-Source veröffentlicht. Auf diese Weise können nun auch andere Trader das Script rezensieren und die Funktionalität überprüfen. Vielen Dank an den Autor! Sie können das Script kostenlos verwenden, aber eine Wiederveröffentlichung des Codes unterliegt unseren Hausregeln.

Haftungsausschluss
Die Informationen und Veröffentlichungen sind nicht als Finanz-, Anlage-, Handels- oder andere Arten von Ratschlägen oder Empfehlungen gedacht, die von TradingView bereitgestellt oder gebilligt werden, und stellen diese nicht dar. Lesen Sie mehr in den Nutzungsbedingungen.
Open-source Skript
Ganz im Sinne von TradingView hat dieser Autor sein/ihr Script als Open-Source veröffentlicht. Auf diese Weise können nun auch andere Trader das Script rezensieren und die Funktionalität überprüfen. Vielen Dank an den Autor! Sie können das Script kostenlos verwenden, aber eine Wiederveröffentlichung des Codes unterliegt unseren Hausregeln.
Haftungsausschluss
Die Informationen und Veröffentlichungen sind nicht als Finanz-, Anlage-, Handels- oder andere Arten von Ratschlägen oder Empfehlungen gedacht, die von TradingView bereitgestellt oder gebilligt werden, und stellen diese nicht dar. Lesen Sie mehr in den Nutzungsbedingungen.