Stock Report Metrics Simulator
📊 Stock Report Metrics Simulator
A complete fundamental + technical scorecard — right on your chart
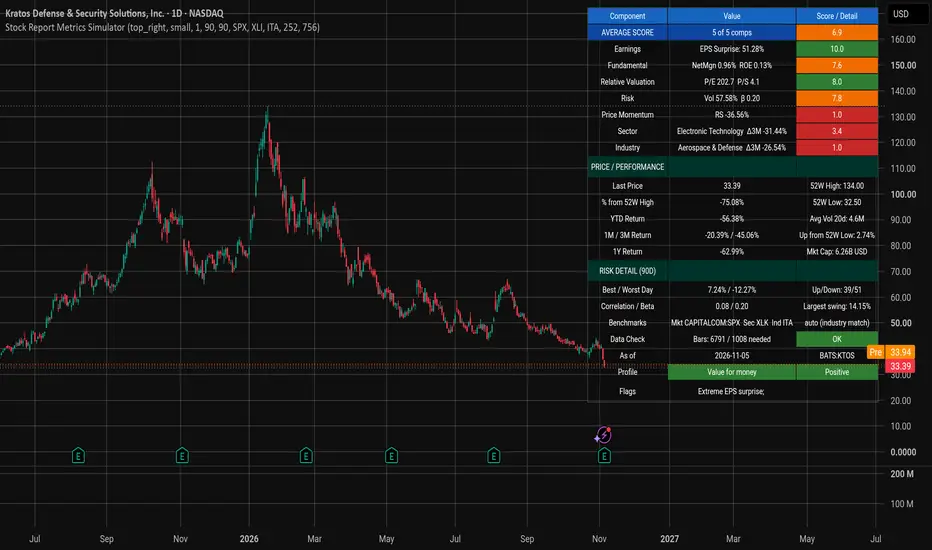
Stock Report Metrics Simulator turns the kind of multi-page equity research report you'd get from a broker into a compact, color-coded scorecard that updates live on every bar. Instead of flipping between earnings reports, valuation multiples and relative-strength charts, you get a single 0–10 average score built from five independent pillars — plus context on how the stock is behaving relative to its own sector and industry.
⚠️ Best used on 1D timeframe. The indicator warns you (red header) if you load it on a non-daily chart, because the fundamental lookbacks and momentum windows assume daily bars.
🎯 The Five Scoring Pillars
Each component is scored 1 – 10 and then averaged into the master Average Score. Anything ≥ 8 is green, 4–8 orange, and < 4 red.
Pillar What it measures How it's scored
Earnings Latest EPS surprise vs consensus Fixed mapping: −20% = 1, 0% = 5.5, +20% = 10
Fundamental Profitability (Net margin, ROE, Gross margin, Rev growth) + Debt (Current ratio, D/E) + Quality (OCF / Net income) Weighted composite, then scored vs its own history
Relative Valuation P/E (TTM) and P/S (TTM) Lower multiple = higher score, vs the stock's own history
Risk 90-day annualised volatility + 252-day beta High score = LOW risk (normalised to a 30% "typical" vol)
Price Momentum Weighted 1W/1M/3M/6M/1Y return composite Scored vs own history
Two additional context scores — Sector Relative and Industry Relative — compare 1M/3M/1Y excess returns against the right benchmark ETF.
🧠 Smart Benchmark Auto-Detection
Forget picking the right comparison ETF manually. The indicator reads syminfo.sector and syminfo.industry and maps US-listed symbols automatically:
Sector fallback: Tech → XLK, Financials → XLF, Health Care → XLV, Energy → XLE, Industrials → XLI, Utilities → XLU, Materials → XLB, Consumer → XLP / XLY, Communications → XLC
Industry precision: Semis → SMH, Biotech → IBB, Aerospace & Defense → ITA, Oil Services → OIH, Gold Miners → GDX, Homebuilders → ITB, Banks → KRE / KBE, Insurance → KIE, Restaurants → PEJ, Airlines → JETS, and 40+ more
If the symbol is non-US, has no matching sector/industry, or you turn auto-detection off, the indicator falls back to your manual sector / industry ETF inputs. The current mode is always shown in the "Benchmarks" row so you know exactly what you're being compared to.
📋 What's in the Table
A 23-row dashboard, fully themeable, positionable, and resizable. Sections:
🟦 Header row — column labels (turns red if not on 1D)
🟦 Score block
AVERAGE SCORE with "X of 5 components available"
Earnings, Fundamental, Relative Valuation, Risk, Momentum, Sector, Industry — each with a coloured score and a hover-tooltip breaking down the underlying numbers
🟦 Price / Performance
Last price, 52-week high & low, % from 52W high, up from 52W low
YTD return, 1M / 3M / 1Y returns, 20-day average volume, market cap
🟦 Risk Detail (90D)
Best / worst day, up vs down days, largest intraday swing
252-day correlation and beta vs the benchmark
🟦 Diagnostics
Benchmarks in use + ETF selection mode
Data-check row: "Bars available / bars needed"
Timestamp + ticker
Profile row — a plain-English rule-based label (see below)
Flags row — one-line warnings ("Loss-making; Extreme EPS surprise; Short history; No P/E")
🏷️ Rule-Based Profile Labels
Rather than make you interpret seven numbers, the indicator classifies the setup into one of these readable tags (first match wins):
✅ Value for money — cheap, profitable, low risk
✅ Quality compounder — strong fundamentals, low risk
✅ Growth story — rev growth ≥ 15% + momentum
✅ Momentum leader — strong momentum + sector outperformance
⚪ Turnaround — earnings improving, fundamentals still weak
✅ Defensive / low risk — low risk score + solid average
🔻 Cheap but weak (value-trap risk)
⚪ Earnings beat, price lagging
🔻 Speculative / high risk
🔻 Weak across the board
A tone badge (Positive / Neutral / Caution) colour-codes the row so you can read the verdict at a glance.
🎨 Chart Markers & Alerts
🟢▲ Score rose by ≥ the marker threshold (default: 1.0 pts)
🔴▼ Score fell by ≥ the marker threshold
🟢● Crossed above 8 (entering strong territory)
🔴● Crossed below 4 (entering weak territory)
🟠◆ Crossed above 4 or below 8 (regime boundary)
Every marker has a matching alertcondition you can hook into webhooks, notifications, or automation.
⚙️ Fully Configurable
Display — show/hide table, 9 positions, 4 text sizes, toggle markers
Theme — separate colour pickers for table BG, row BG, header BG, average-score BG, section BG, and text
Data — benchmark symbol, auto-detection on/off, manual sector & industry ETFs
Scoring — momentum / risk normalisation lookback (default 252 bars), fundamental lookback (default 756 bars), marker sensitivity
📌 Best Practices
Load on a 1D chart with enough history. The indicator needs fundLB + 252 bars — around 1008 daily bars (~4 years) by default — to fully populate. The Data Check row tells you if you're short.
Combine with price action — scores describe the setup, not the timing.
Use auto-detection for US stocks, and set manual ETFs for ADRs, indices, or anything exotic.
Compare across a watchlist — sort by Average Score to instantly find the strongest quality/momentum/risk picture.
⚠️ Important Limitations
request.earnings and request.financial only populate reliably for symbols with data on TradingView. Small caps, international names, and non-equity instruments will show many n/a values.
Pine Script cannot expose analyst estimate revisions or recommendation changes, so Earnings is scored from surprise only (clearly noted in the tooltip).
The momentum composite does not include seasonality (the report this was inspired by does — Pine can't replicate it cleanly).
All data-driven scores are relative to the stock's own history, not an absolute scale. A "score 8" on risk means "less volatile than this stock usually is", not "low absolute risk".
💡 Under the Hood (for the curious)
Scores use ta.percentrank over a configurable window → linear 1–10 mapping
TTM fundamentals for P/E and P/S; quarterly for margin / ROE / balance-sheet ratios
Revenue growth compares to the value 4 reported quarters ago (not 4 bars ago) so interim gaps don't break the YoY comparison
Risk score inverts the percentile (scoreL) so higher = safer
All ta.* calls are evaluated every bar so alerts and plot values stay in sync
🧪 Suggested Use Cases
Screening: Pin the table to a multi-chart layout and scan your watchlist
Position sizing: Use the Risk score to weight allocations by relative safety
Rotation: Use Sector / Industry relative scores to catch names that are outperforming their peers
Earnings seasons: Watch the Earnings score and its delta markers for post-report shifts
Value-trap avoidance: The "Cheap but weak" profile explicitly flags the danger case
Happy hunting — and remember: scores are a map, not the territory. Always do your own due diligence. 📈
A complete fundamental + technical scorecard — right on your chart
Stock Report Metrics Simulator turns the kind of multi-page equity research report you'd get from a broker into a compact, color-coded scorecard that updates live on every bar. Instead of flipping between earnings reports, valuation multiples and relative-strength charts, you get a single 0–10 average score built from five independent pillars — plus context on how the stock is behaving relative to its own sector and industry.
⚠️ Best used on 1D timeframe. The indicator warns you (red header) if you load it on a non-daily chart, because the fundamental lookbacks and momentum windows assume daily bars.
🎯 The Five Scoring Pillars
Each component is scored 1 – 10 and then averaged into the master Average Score. Anything ≥ 8 is green, 4–8 orange, and < 4 red.
Pillar What it measures How it's scored
Earnings Latest EPS surprise vs consensus Fixed mapping: −20% = 1, 0% = 5.5, +20% = 10
Fundamental Profitability (Net margin, ROE, Gross margin, Rev growth) + Debt (Current ratio, D/E) + Quality (OCF / Net income) Weighted composite, then scored vs its own history
Relative Valuation P/E (TTM) and P/S (TTM) Lower multiple = higher score, vs the stock's own history
Risk 90-day annualised volatility + 252-day beta High score = LOW risk (normalised to a 30% "typical" vol)
Price Momentum Weighted 1W/1M/3M/6M/1Y return composite Scored vs own history
Two additional context scores — Sector Relative and Industry Relative — compare 1M/3M/1Y excess returns against the right benchmark ETF.
🧠 Smart Benchmark Auto-Detection
Forget picking the right comparison ETF manually. The indicator reads syminfo.sector and syminfo.industry and maps US-listed symbols automatically:
Sector fallback: Tech → XLK, Financials → XLF, Health Care → XLV, Energy → XLE, Industrials → XLI, Utilities → XLU, Materials → XLB, Consumer → XLP / XLY, Communications → XLC
Industry precision: Semis → SMH, Biotech → IBB, Aerospace & Defense → ITA, Oil Services → OIH, Gold Miners → GDX, Homebuilders → ITB, Banks → KRE / KBE, Insurance → KIE, Restaurants → PEJ, Airlines → JETS, and 40+ more
If the symbol is non-US, has no matching sector/industry, or you turn auto-detection off, the indicator falls back to your manual sector / industry ETF inputs. The current mode is always shown in the "Benchmarks" row so you know exactly what you're being compared to.
📋 What's in the Table
A 23-row dashboard, fully themeable, positionable, and resizable. Sections:
🟦 Header row — column labels (turns red if not on 1D)
🟦 Score block
AVERAGE SCORE with "X of 5 components available"
Earnings, Fundamental, Relative Valuation, Risk, Momentum, Sector, Industry — each with a coloured score and a hover-tooltip breaking down the underlying numbers
🟦 Price / Performance
Last price, 52-week high & low, % from 52W high, up from 52W low
YTD return, 1M / 3M / 1Y returns, 20-day average volume, market cap
🟦 Risk Detail (90D)
Best / worst day, up vs down days, largest intraday swing
252-day correlation and beta vs the benchmark
🟦 Diagnostics
Benchmarks in use + ETF selection mode
Data-check row: "Bars available / bars needed"
Timestamp + ticker
Profile row — a plain-English rule-based label (see below)
Flags row — one-line warnings ("Loss-making; Extreme EPS surprise; Short history; No P/E")
🏷️ Rule-Based Profile Labels
Rather than make you interpret seven numbers, the indicator classifies the setup into one of these readable tags (first match wins):
✅ Value for money — cheap, profitable, low risk
✅ Quality compounder — strong fundamentals, low risk
✅ Growth story — rev growth ≥ 15% + momentum
✅ Momentum leader — strong momentum + sector outperformance
⚪ Turnaround — earnings improving, fundamentals still weak
✅ Defensive / low risk — low risk score + solid average
🔻 Cheap but weak (value-trap risk)
⚪ Earnings beat, price lagging
🔻 Speculative / high risk
🔻 Weak across the board
A tone badge (Positive / Neutral / Caution) colour-codes the row so you can read the verdict at a glance.
🎨 Chart Markers & Alerts
🟢▲ Score rose by ≥ the marker threshold (default: 1.0 pts)
🔴▼ Score fell by ≥ the marker threshold
🟢● Crossed above 8 (entering strong territory)
🔴● Crossed below 4 (entering weak territory)
🟠◆ Crossed above 4 or below 8 (regime boundary)
Every marker has a matching alertcondition you can hook into webhooks, notifications, or automation.
⚙️ Fully Configurable
Display — show/hide table, 9 positions, 4 text sizes, toggle markers
Theme — separate colour pickers for table BG, row BG, header BG, average-score BG, section BG, and text
Data — benchmark symbol, auto-detection on/off, manual sector & industry ETFs
Scoring — momentum / risk normalisation lookback (default 252 bars), fundamental lookback (default 756 bars), marker sensitivity
📌 Best Practices
Load on a 1D chart with enough history. The indicator needs fundLB + 252 bars — around 1008 daily bars (~4 years) by default — to fully populate. The Data Check row tells you if you're short.
Combine with price action — scores describe the setup, not the timing.
Use auto-detection for US stocks, and set manual ETFs for ADRs, indices, or anything exotic.
Compare across a watchlist — sort by Average Score to instantly find the strongest quality/momentum/risk picture.
⚠️ Important Limitations
request.earnings and request.financial only populate reliably for symbols with data on TradingView. Small caps, international names, and non-equity instruments will show many n/a values.
Pine Script cannot expose analyst estimate revisions or recommendation changes, so Earnings is scored from surprise only (clearly noted in the tooltip).
The momentum composite does not include seasonality (the report this was inspired by does — Pine can't replicate it cleanly).
All data-driven scores are relative to the stock's own history, not an absolute scale. A "score 8" on risk means "less volatile than this stock usually is", not "low absolute risk".
💡 Under the Hood (for the curious)
Scores use ta.percentrank over a configurable window → linear 1–10 mapping
TTM fundamentals for P/E and P/S; quarterly for margin / ROE / balance-sheet ratios
Revenue growth compares to the value 4 reported quarters ago (not 4 bars ago) so interim gaps don't break the YoY comparison
Risk score inverts the percentile (scoreL) so higher = safer
All ta.* calls are evaluated every bar so alerts and plot values stay in sync
🧪 Suggested Use Cases
Screening: Pin the table to a multi-chart layout and scan your watchlist
Position sizing: Use the Risk score to weight allocations by relative safety
Rotation: Use Sector / Industry relative scores to catch names that are outperforming their peers
Earnings seasons: Watch the Earnings score and its delta markers for post-report shifts
Value-trap avoidance: The "Cheap but weak" profile explicitly flags the danger case
Happy hunting — and remember: scores are a map, not the territory. Always do your own due diligence. 📈

Haftungsausschluss
Die Informationen und Veröffentlichungen sind nicht als Finanz-, Anlage-, Handels- oder andere Arten von Ratschlägen oder Empfehlungen gedacht, die von TradingView bereitgestellt oder gebilligt werden, und stellen diese nicht dar. Lesen Sie mehr in den Nutzungsbedingungen.
Haftungsausschluss
Die Informationen und Veröffentlichungen sind nicht als Finanz-, Anlage-, Handels- oder andere Arten von Ratschlägen oder Empfehlungen gedacht, die von TradingView bereitgestellt oder gebilligt werden, und stellen diese nicht dar. Lesen Sie mehr in den Nutzungsbedingungen.