OPEN-SOURCE SCRIPT
Trendline Bounce [EXCAVO]
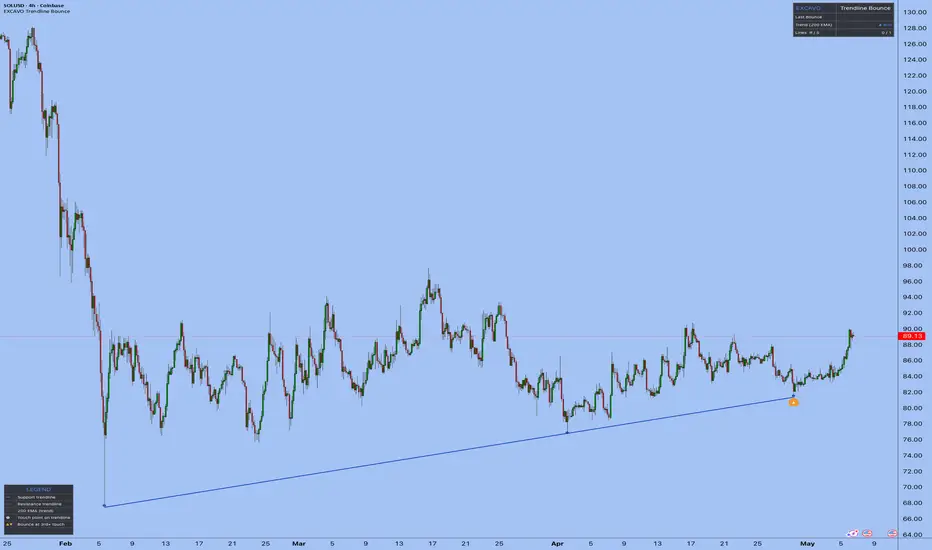
Automatic Trendline Detection with Multi-Stage Bounce Detection and Quality Filters
The Trendline Bounce automatically identifies support and resistance trendlines
validated by three or more confirmed pivot touches. When price returns to an established
line, the indicator places a directional bounce arrow and triggers the alert. A dual-
lookback architecture fires earlier than traditional pivot-confirmation methods, while
span, regime, and trend filters eliminate structurally weak or contextually invalid setups.
This is not a simple two-point line connector. The slope is derived from a best-fit
search across all qualifying pivots, every candidate line is rejected if any candle
between touch points crosses the boundary, and three parallel detection channels reduce
the confirmation delay without sacrificing structural validity.
━━━━━━━━━━━━━━━━━━━━━━━━━━━━━━━━━━━━━━━
▸ HOW TO USE
Step 1 → Add the indicator. Trendlines appear immediately - solid line
is the most recent valid line per direction, dashed lines are
the previous ones (up to Max Lines per Side).
Step 2 → Watch for the bounce arrow. A triangle (▲ or ▼) marks the bar
where the third or later touch is detected. Check the dashboard
for the quality grade (A / B / C).
Step 3 → Use the Trend Filter and ATR Regime Filter inputs to narrow the
context. Enable Trend Filter to gate bounces by 200 EMA direction.
Enable ATR Regime Filter to suppress detections during extreme
volatility spikes.
Step 4 → Adjust Early Detection Lookback to trade off timing vs. accuracy.
Lower values fire earlier but may produce more noise. The Detection
Lookback controls the quality trendline anchor; Early Detection
Lookback controls how quickly subsequent touches are confirmed.
Step 5 → Use dashed historical lines for context. They show where price
previously respected trendlines and may act as reference levels.
Step 6 → Set alerts to monitor conditions in real time. Use "Any Bounce"
for general monitoring or direction-specific alerts for automated
setups via webhook.
━━━━━━━━━━━━━━━━━━━━━━━━━━━━━━━━━━━━━━━
▸ HOW IT CALCULATES
◆ Pivot Detection (Quality Layer)
Swing highs and lows are confirmed using ta.pivothigh() / ta.pivotlow() with
Detection Lookback bars required on each side (default 14). A pivot high at bar B
requires bar B's high to be the maximum of the surrounding 14 bars on both sides.
Up to 60 pivots per direction are stored in a rolling buffer. These quality pivots
form the structural anchor for trendline fitting.
◆ Best-Slope Trendline Fitting
For each anchor pivot A, the algorithm scans all other pivots B to compute slope:
sl = (price_B - price_A) / (bar_B - bar_A). Slopes steeper than 0.5 x ATR per bar
are rejected. For each valid slope, the algorithm counts how many pivots fall within
ATR x Tolerance of the projected line. The slope maximizing confirmed touch count
(minimum 3) is selected. This approach finds the line that fits the most pivots
rather than simply connecting two points.
◆ Breakout Rejection Sampling
Once a candidate line passes the touch count test, 60 evenly spaced bars between the
first and last touch are sampled. If any sampled bar's high (for resistance) or low
(for support) exceeds the projected price plus tolerance, the line is rejected. This
catches wick or body violations between pivot points that pure pivot-based validation
would miss.
◆ Minimum Span Filter
A trendline whose first and last touch are fewer than Min Trendline Span bars apart
is discarded. Three pivots clustered within a few bars share no structural significance.
This filter ensures every displayed line represents a meaningful price reaction period,
not a short-term oscillation.
◆ Three-Channel Bounce Detection
After the structural line set is built, three parallel detection channels produce the
bounce arrow:
1. Quality path: when the most recent quality pivot (i_len delay) falls on an
established line within the tolerance band, a detection fires.
2. Early path: when the most recent fast pivot (Early Detection Lookback, default 5)
touches an already-established quality trendline, a detection fires earlier than
waiting for full quality confirmation.
3. Real-time path: every tick, each stored trendline is projected to the current bar.
If the current bar's high (resistance) or low (support) enters the tolerance band,
a detection fires immediately without waiting for pivot confirmation.
All three channels require the line to have been built from quality pivots. The early
and real-time channels only fire against pre-validated structural lines - they do not
create new lines themselves.
◆ Trend and Regime Gates
Two optional gates filter the output of all three detection channels. The Trend Filter
(200 EMA) passes bullish detections only when close is above the EMA and bearish
detections only when close is below. The ATR Regime Filter computes
ta.percentrank(ATR, 200) / 100 and suppresses all detections when the result exceeds
0.90 - this blocks entries during the top 10% of volatility events where trendline
breaks are more likely than bounces.
◆ Bounce Grade (A / B / C)
Each detected bounce is evaluated at the detection bar: volume ratio = volume /
SMA(volume, 20); wick position = (close - low) / (high - low) for bullish or
(high - close) / (high - low) for bearish. Grade A requires volume ratio >= 2.0
AND wick position >= 0.60. Grade B requires ratio >= 1.5 OR position >= 0.50.
Grade C is assigned otherwise.
━━━━━━━━━━━━━━━━━━━━━━━━━━━━━━━━━━━━━━━
▸ WHAT MAKES IT DIFFERENT
◆ Best-Slope Fitting Across All Pivots
Rather than connecting only two pivots, the algorithm finds the slope that maximizes
the number of confirmed touches. A line with three near-misses is ranked higher than
a line connecting two pivots perfectly, because more touches represent stronger
structural significance.
◆ Breakout Rejection via Bar Sampling
Most trendline tools draw a line between any two pivots regardless of what happens in
between. This indicator samples 60 bars between the first and last touch and rejects
any line where a candle crosses the boundary. Only lines price has genuinely respected
are shown.
◆ Minimum Span Filter
Trendlines that form in fewer bars than the span threshold are discarded. This removes
short-term pivot clusters that look like trendlines but carry no structural weight.
The result is fewer, higher-quality lines.
◆ Three-Channel Detection for Earlier Timing
Traditional trendline indicators confirm a bounce only after the full pivot lookback
elapses - on a 4H chart with lookback 14, that is 56 hours after the actual low. The
early detection channel reduces this to 5 bars (20 hours on 4H). The real-time channel
fires on the current bar. Both channels require the line to already be structurally
validated - they reduce timing delay without introducing unvalidated lines.
◆ Trend and Regime Filters
The 200 EMA gate removes counter-trend detections. The ATR regime gate suppresses
detections during the highest-volatility periods where trendline structure tends to
break rather than hold. Both filters are optional and off by default.
◆ Exact Touch Markers
Circles are placed at actual candle prices (high for resistance, low for support), not
at the theoretical projected price on the line. This makes it immediately visible
whether the wick tapped the line or the body closed through it.
━━━━━━━━━━━━━━━━━━━━━━━━━━━━━━━━━━━━━━━
▸ DASHBOARD
Real-time panel (top right corner) showing current state:
Legend table (bottom left) explains every visual element. Both panels can be
toggled independently in Dashboard settings.
━━━━━━━━━━━━━━━━━━━━━━━━━━━━━━━━━━━━━━━
▸ SETTINGS
Trendlines
Bounce Detection
Visualization
Dashboard
Alert Settings
━━━━━━━━━━━━━━━━━━━━━━━━━━━━━━━━━━━━━━━
▸ ALERTS
All alerts respect the Allow Repainting setting. When off, bounces are confirmed
at bar close only. JSON Alerts option sends a structured payload with ticker,
price, timeframe, direction, and grade fields.
━━━━━━━━━━━━━━━━━━━━━━━━━━━━━━━━━━━━━━━
Best regards,
EXCAVO
The Trendline Bounce automatically identifies support and resistance trendlines
validated by three or more confirmed pivot touches. When price returns to an established
line, the indicator places a directional bounce arrow and triggers the alert. A dual-
lookback architecture fires earlier than traditional pivot-confirmation methods, while
span, regime, and trend filters eliminate structurally weak or contextually invalid setups.
This is not a simple two-point line connector. The slope is derived from a best-fit
search across all qualifying pivots, every candidate line is rejected if any candle
between touch points crosses the boundary, and three parallel detection channels reduce
the confirmation delay without sacrificing structural validity.
━━━━━━━━━━━━━━━━━━━━━━━━━━━━━━━━━━━━━━━
▸ HOW TO USE
Step 1 → Add the indicator. Trendlines appear immediately - solid line
is the most recent valid line per direction, dashed lines are
the previous ones (up to Max Lines per Side).
Step 2 → Watch for the bounce arrow. A triangle (▲ or ▼) marks the bar
where the third or later touch is detected. Check the dashboard
for the quality grade (A / B / C).
Step 3 → Use the Trend Filter and ATR Regime Filter inputs to narrow the
context. Enable Trend Filter to gate bounces by 200 EMA direction.
Enable ATR Regime Filter to suppress detections during extreme
volatility spikes.
Step 4 → Adjust Early Detection Lookback to trade off timing vs. accuracy.
Lower values fire earlier but may produce more noise. The Detection
Lookback controls the quality trendline anchor; Early Detection
Lookback controls how quickly subsequent touches are confirmed.
Step 5 → Use dashed historical lines for context. They show where price
previously respected trendlines and may act as reference levels.
Step 6 → Set alerts to monitor conditions in real time. Use "Any Bounce"
for general monitoring or direction-specific alerts for automated
setups via webhook.
━━━━━━━━━━━━━━━━━━━━━━━━━━━━━━━━━━━━━━━
▸ HOW IT CALCULATES
◆ Pivot Detection (Quality Layer)
Swing highs and lows are confirmed using ta.pivothigh() / ta.pivotlow() with
Detection Lookback bars required on each side (default 14). A pivot high at bar B
requires bar B's high to be the maximum of the surrounding 14 bars on both sides.
Up to 60 pivots per direction are stored in a rolling buffer. These quality pivots
form the structural anchor for trendline fitting.
◆ Best-Slope Trendline Fitting
For each anchor pivot A, the algorithm scans all other pivots B to compute slope:
sl = (price_B - price_A) / (bar_B - bar_A). Slopes steeper than 0.5 x ATR per bar
are rejected. For each valid slope, the algorithm counts how many pivots fall within
ATR x Tolerance of the projected line. The slope maximizing confirmed touch count
(minimum 3) is selected. This approach finds the line that fits the most pivots
rather than simply connecting two points.
◆ Breakout Rejection Sampling
Once a candidate line passes the touch count test, 60 evenly spaced bars between the
first and last touch are sampled. If any sampled bar's high (for resistance) or low
(for support) exceeds the projected price plus tolerance, the line is rejected. This
catches wick or body violations between pivot points that pure pivot-based validation
would miss.
◆ Minimum Span Filter
A trendline whose first and last touch are fewer than Min Trendline Span bars apart
is discarded. Three pivots clustered within a few bars share no structural significance.
This filter ensures every displayed line represents a meaningful price reaction period,
not a short-term oscillation.
◆ Three-Channel Bounce Detection
After the structural line set is built, three parallel detection channels produce the
bounce arrow:
1. Quality path: when the most recent quality pivot (i_len delay) falls on an
established line within the tolerance band, a detection fires.
2. Early path: when the most recent fast pivot (Early Detection Lookback, default 5)
touches an already-established quality trendline, a detection fires earlier than
waiting for full quality confirmation.
3. Real-time path: every tick, each stored trendline is projected to the current bar.
If the current bar's high (resistance) or low (support) enters the tolerance band,
a detection fires immediately without waiting for pivot confirmation.
All three channels require the line to have been built from quality pivots. The early
and real-time channels only fire against pre-validated structural lines - they do not
create new lines themselves.
◆ Trend and Regime Gates
Two optional gates filter the output of all three detection channels. The Trend Filter
(200 EMA) passes bullish detections only when close is above the EMA and bearish
detections only when close is below. The ATR Regime Filter computes
ta.percentrank(ATR, 200) / 100 and suppresses all detections when the result exceeds
0.90 - this blocks entries during the top 10% of volatility events where trendline
breaks are more likely than bounces.
◆ Bounce Grade (A / B / C)
Each detected bounce is evaluated at the detection bar: volume ratio = volume /
SMA(volume, 20); wick position = (close - low) / (high - low) for bullish or
(high - close) / (high - low) for bearish. Grade A requires volume ratio >= 2.0
AND wick position >= 0.60. Grade B requires ratio >= 1.5 OR position >= 0.50.
Grade C is assigned otherwise.
━━━━━━━━━━━━━━━━━━━━━━━━━━━━━━━━━━━━━━━
▸ WHAT MAKES IT DIFFERENT
◆ Best-Slope Fitting Across All Pivots
Rather than connecting only two pivots, the algorithm finds the slope that maximizes
the number of confirmed touches. A line with three near-misses is ranked higher than
a line connecting two pivots perfectly, because more touches represent stronger
structural significance.
◆ Breakout Rejection via Bar Sampling
Most trendline tools draw a line between any two pivots regardless of what happens in
between. This indicator samples 60 bars between the first and last touch and rejects
any line where a candle crosses the boundary. Only lines price has genuinely respected
are shown.
◆ Minimum Span Filter
Trendlines that form in fewer bars than the span threshold are discarded. This removes
short-term pivot clusters that look like trendlines but carry no structural weight.
The result is fewer, higher-quality lines.
◆ Three-Channel Detection for Earlier Timing
Traditional trendline indicators confirm a bounce only after the full pivot lookback
elapses - on a 4H chart with lookback 14, that is 56 hours after the actual low. The
early detection channel reduces this to 5 bars (20 hours on 4H). The real-time channel
fires on the current bar. Both channels require the line to already be structurally
validated - they reduce timing delay without introducing unvalidated lines.
◆ Trend and Regime Filters
The 200 EMA gate removes counter-trend detections. The ATR regime gate suppresses
detections during the highest-volatility periods where trendline structure tends to
break rather than hold. Both filters are optional and off by default.
◆ Exact Touch Markers
Circles are placed at actual candle prices (high for resistance, low for support), not
at the theoretical projected price on the line. This makes it immediately visible
whether the wick tapped the line or the body closed through it.
━━━━━━━━━━━━━━━━━━━━━━━━━━━━━━━━━━━━━━━
▸ DASHBOARD
Real-time panel (top right corner) showing current state:
- Last Bounce - direction (▲ bullish / ▼ bearish) and quality grade (A/B/C) of the most recent bounce
- Trend (200 EMA) - current price position relative to 200 EMA (▲ Bull / ▼ Bear)
- Lines R / S - count of currently active resistance and support trendlines
Legend table (bottom left) explains every visual element. Both panels can be
toggled independently in Dashboard settings.
━━━━━━━━━━━━━━━━━━━━━━━━━━━━━━━━━━━━━━━
▸ SETTINGS
Trendlines
- Detection Lookback - 14 bars (bars on each side to confirm a quality swing pivot; higher = fewer but stronger lines)
- Max Lines per Side - 5 (maximum number of trendlines shown per direction)
- Tolerance (xATR) - 0.5 (ATR multiple defining how close a pivot must be to the line to count as a touch)
- Min Trendline Span - 30 bars (minimum bars between first and last touch; filters structurally insignificant lines)
Bounce Detection
- Min Touches - 3 (minimum confirmed touches before a bounce arrow appears)
- Show Grade (A/B/C) - ON (display quality grade in the dashboard)
- Early Detection Lookback - 5 bars (shorter lookback for faster bounce detection on established lines)
- Trend Filter (200 EMA) - OFF (when ON: bullish bounces above EMA only, bearish below only)
- ATR Regime Filter - OFF (when ON: suppresses detections when ATR is above 90th percentile of last 200 bars)
Visualization
- Support Color - blue (color for support trendlines and bullish bounce arrows)
- Resistance Color - red (color for resistance trendlines and bearish bounce arrows)
- Bounce Color - orange (color for bounce arrows)
- Bar Coloring - OFF (color bars on bounce detection using direction color)
- Show 200 EMA - OFF (plot 200-bar EMA on the chart)
Dashboard
- Show Dashboard - ON
- Dashboard Position - Top Right (Top Right / Top Left / Bottom Right / Bottom Left)
- Show Legend - ON
Alert Settings
- Allow Repainting - OFF (when off, detection confirms at bar close; enable only if monitoring open bars)
- JSON Alerts - OFF (structured JSON payload for webhook automation)
━━━━━━━━━━━━━━━━━━━━━━━━━━━━━━━━━━━━━━━
▸ ALERTS
- Bullish Bounce - price touches a confirmed support trendline for the 3rd+ time
- Bearish Bounce - price touches a confirmed resistance trendline for the 3rd+ time
- Any Bounce - bounce detected in either direction
All alerts respect the Allow Repainting setting. When off, bounces are confirmed
at bar close only. JSON Alerts option sends a structured payload with ticker,
price, timeframe, direction, and grade fields.
━━━━━━━━━━━━━━━━━━━━━━━━━━━━━━━━━━━━━━━
Best regards,
EXCAVO
Disclaimer
Trading involves significant risk. This indicator is a technical analysis tool
and does not constitute financial advice, investment recommendations, or a
guarantee of future results. Past indicator behavior does not guarantee future
performance. Always use proper risk management and your own judgment.
Open-source Skript
Ganz im Sinne von TradingView hat dieser Autor sein/ihr Script als Open-Source veröffentlicht. Auf diese Weise können nun auch andere Trader das Script rezensieren und die Funktionalität überprüfen. Vielen Dank an den Autor! Sie können das Script kostenlos verwenden, aber eine Wiederveröffentlichung des Codes unterliegt unseren Hausregeln.

👋 Trading since 2013 · TA & Indicators
TT - trading-tournaments.com/tournaments
Free analysis → t.me/+Qm96gDz3qdyNOs8t
Indicators → excavo.com/
🎓 Get EXCAVO Core,VIP, Academy → t.me/EXCAVOREFF_bot
TT - trading-tournaments.com/tournaments
Free analysis → t.me/+Qm96gDz3qdyNOs8t
Indicators → excavo.com/
🎓 Get EXCAVO Core,VIP, Academy → t.me/EXCAVOREFF_bot
Haftungsausschluss
Die Informationen und Veröffentlichungen sind nicht als Finanz-, Anlage-, Handels- oder andere Arten von Ratschlägen oder Empfehlungen gedacht, die von TradingView bereitgestellt oder gebilligt werden, und stellen diese nicht dar. Lesen Sie mehr in den Nutzungsbedingungen.
Open-source Skript
Ganz im Sinne von TradingView hat dieser Autor sein/ihr Script als Open-Source veröffentlicht. Auf diese Weise können nun auch andere Trader das Script rezensieren und die Funktionalität überprüfen. Vielen Dank an den Autor! Sie können das Script kostenlos verwenden, aber eine Wiederveröffentlichung des Codes unterliegt unseren Hausregeln.
👋 Trading since 2013 · TA & Indicators
TT - trading-tournaments.com/tournaments
Free analysis → t.me/+Qm96gDz3qdyNOs8t
Indicators → excavo.com/
🎓 Get EXCAVO Core,VIP, Academy → t.me/EXCAVOREFF_bot
TT - trading-tournaments.com/tournaments
Free analysis → t.me/+Qm96gDz3qdyNOs8t
Indicators → excavo.com/
🎓 Get EXCAVO Core,VIP, Academy → t.me/EXCAVOREFF_bot
Haftungsausschluss
Die Informationen und Veröffentlichungen sind nicht als Finanz-, Anlage-, Handels- oder andere Arten von Ratschlägen oder Empfehlungen gedacht, die von TradingView bereitgestellt oder gebilligt werden, und stellen diese nicht dar. Lesen Sie mehr in den Nutzungsbedingungen.