Aktualisiert
Fundamental Valuation Snapshot [FVS]
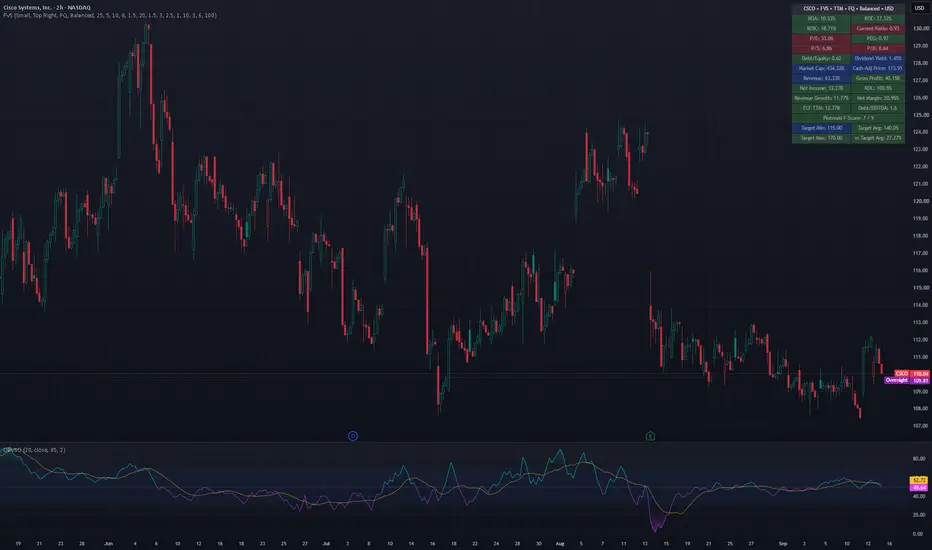
Fundamental Valuation Snapshot [FVS]
Fundamental Valuation Snapshot [FVS] is a compact fundamental dashboard designed to provide a quick view of a company's profitability, valuation, financial strength, growth, cash generation, and analyst expectations directly on the chart.
The panel includes ROA, ROE, ROIC, Current Ratio, P/E, PEG, P/S, P/B, Debt/Equity, Dividend Yield, Market Capitalization, Cash-Adjusted Price, Revenue, Gross Profit, Net Income, Return on Capital (ROC), Revenue Growth, Net Margin, Free Cash Flow, Debt/EBITDA, Piotroski F-Score, and analyst price targets when the data is available from TradingView.
Valuation Color Profiles
FVS includes four configurable valuation profiles:
The selected profile changes only the thresholds used for color grading. It does not alter the underlying financial data.
Green indicates that a metric meets the selected profile's preferred threshold. Blue represents a neutral tolerance zone around the threshold. Red indicates that the metric is outside the profile's preferred range. Gray indicates unavailable data.
The Neutral Zone Tolerance setting can be adjusted to make the grading system stricter or more flexible.
Because valuation norms differ significantly between industries and business models, these profiles should be treated as screening guidelines rather than universal definitions of fair value. The Custom profile allows users to define their own thresholds.
Credits
This indicator was originally inspired by and partially adapted from the open-source "Valuation Table" by TradingView author kenhuangsy2.
FVS substantially expands the original concept with additional fundamental metrics, configurable fiscal periods, valuation and quality profiles, tolerance-based color grading, cash-adjusted price calculations, analyst price targets, Piotroski F-Score, additional financial statement data, formatting utilities, configurable panel sizing and positioning, and a Pine Script v6 implementation.
Published open-source under the Mozilla Public License 2.0.
This indicator is intended as a fundamental research and screening tool. Its colors and valuation profiles are contextual aids and should not be interpreted as investment recommendations or automatic buy/sell signals.
Fundamental Valuation Snapshot [FVS] is a compact fundamental dashboard designed to provide a quick view of a company's profitability, valuation, financial strength, growth, cash generation, and analyst expectations directly on the chart.
The panel includes ROA, ROE, ROIC, Current Ratio, P/E, PEG, P/S, P/B, Debt/Equity, Dividend Yield, Market Capitalization, Cash-Adjusted Price, Revenue, Gross Profit, Net Income, Return on Capital (ROC), Revenue Growth, Net Margin, Free Cash Flow, Debt/EBITDA, Piotroski F-Score, and analyst price targets when the data is available from TradingView.
Valuation Color Profiles
FVS includes four configurable valuation profiles:
- * Conservative
- * Balanced
- * Growth
- * Custom
The selected profile changes only the thresholds used for color grading. It does not alter the underlying financial data.
Green indicates that a metric meets the selected profile's preferred threshold. Blue represents a neutral tolerance zone around the threshold. Red indicates that the metric is outside the profile's preferred range. Gray indicates unavailable data.
The Neutral Zone Tolerance setting can be adjusted to make the grading system stricter or more flexible.
Because valuation norms differ significantly between industries and business models, these profiles should be treated as screening guidelines rather than universal definitions of fair value. The Custom profile allows users to define their own thresholds.
Credits
This indicator was originally inspired by and partially adapted from the open-source "Valuation Table" by TradingView author kenhuangsy2.
FVS substantially expands the original concept with additional fundamental metrics, configurable fiscal periods, valuation and quality profiles, tolerance-based color grading, cash-adjusted price calculations, analyst price targets, Piotroski F-Score, additional financial statement data, formatting utilities, configurable panel sizing and positioning, and a Pine Script v6 implementation.
Published open-source under the Mozilla Public License 2.0.
This indicator is intended as a fundamental research and screening tool. Its colors and valuation profiles are contextual aids and should not be interpreted as investment recommendations or automatic buy/sell signals.
Versionshinweise
Version 1.1- Improved runtime and memory efficiency for the Fundamental Valuation Snapshot.
- Added automatic timeframe protection: the Valuation Panel and Additional Metrics are disabled on chart timeframes below 1H, while Analyst Price Targets remain available.
- Valuation Panel, Additional Metrics, and Analyst Price Targets now operate as independent display sections.
- Optimized financial-data loading using a last-state request model to avoid unnecessary repeated fundamental requests across chart history.
- Limited the indicator calculation history to improve memory efficiency while preserving the current fundamental snapshot.
- Analyst Price Targets are now retrieved through a lightweight Daily context, improving availability on higher chart timeframes such as Monthly.
- Reorganized Panel Size and Panel Position controls for a cleaner settings layout.
Timeframe note:
FVS is designed primarily for fundamental valuation and company-quality assessment. On timeframes below 1H, where charts are typically used more for entry timing and execution, the heavier fundamental sections are automatically disabled. Analyst Price Targets remain accessible.

Haftungsausschluss
Die Informationen und Veröffentlichungen sind nicht als Finanz-, Anlage-, Handels- oder andere Arten von Ratschlägen oder Empfehlungen gedacht, die von TradingView bereitgestellt oder gebilligt werden, und stellen diese nicht dar. Lesen Sie mehr in den Nutzungsbedingungen.
Haftungsausschluss
Die Informationen und Veröffentlichungen sind nicht als Finanz-, Anlage-, Handels- oder andere Arten von Ratschlägen oder Empfehlungen gedacht, die von TradingView bereitgestellt oder gebilligt werden, und stellen diese nicht dar. Lesen Sie mehr in den Nutzungsbedingungen.