[DAOL] Breakout Acceptance
⏺️ What is it?
[DAOL] Breakout Acceptance tracks what happens after price closes above or below a previous price range.
Instead of treating every breakout as confirmation of a new trend, it observes whether subsequent closes remain outside the original range or return inside it.
🔹 Previous Range — the highest high and lowest low of the preceding N bars
🔹 Frozen Range — the original range locked when a breakout occurs
🔹 Outside Closes — the number of observed bars that close beyond the broken boundary
🔹 Penetration — how deeply a closing price returns into the frozen range
⏺️ Indicator นี้คืออะไร?
[DAOL] Breakout Acceptance คือเครื่องมือติดตามพฤติกรรมราคา หลังราคาปิดทะลุกรอบเดิม
เมื่อเกิดการทะลุ Indicator จะล็อกกรอบ ณ เวลานั้น แล้วตรวจว่าราคาปิดในแท่งถัดไปยังยืนอยู่นอกกรอบได้ หรือกลับเข้ามาภายในกรอบ
🔹 Previous Range — กรอบจาก High สูงสุดและ Low ต่ำสุดของ N แท่งก่อนหน้า
🔹 Frozen Range — กรอบเดิมที่ล็อกไว้เมื่อราคาปิดทะลุ
🔹 Outside Closes — จำนวนแท่งที่ราคาปิดอยู่นอกขอบกรอบด้านที่ทะลุ
🔹 Penetration — ระยะที่ราคาปิดกลับเข้ากรอบ เทียบกับความกว้างกรอบเดิม
⏺️ Why use Breakout Acceptance?
🔹 Adds closed-bar evidence after an initial breakout
🔹 Distinguishes persistent outside closes from repeated returns into the range
🔹 Keeps the breakout reference fixed throughout each observation event
🔹 Provides context for breakout and retest analysis
“Acceptance” is an operational classification based on the selected rules. It does not prove institutional participation or guarantee continuation.
⏺️ ทำไมต้องใช้?
🔹 ช่วยดูพฤติกรรมหลังทะลุ โดยใช้ข้อมูลจากแท่งที่ปิดแล้ว
🔹 แยกการปิดนอกกรอบอย่างต่อเนื่อง ออกจากการปิดสลับกลับเข้ากรอบ
🔹 ใช้ระดับอ้างอิงเดิมตลอดช่วงติดตามแต่ละเหตุการณ์
🔹 ใช้ประกอบการวิเคราะห์ Breakout และ Retest
คำว่า “Acceptance” ใน Indicator นี้หมายถึง ผ่านเกณฑ์การยืนราคาที่กำหนด ไม่ได้ยืนยันว่ามีแรงซื้อขายจากสถาบัน หรือรับประกันว่าราคาจะไปต่อ
⏺️ Who should use it?
🔹 Traders who analyze breakouts from recent price ranges
🔹 Day traders and swing traders monitoring post-breakout behavior
🔹 Technical analysts combining support/resistance with closing-price confirmation
🔹 Users seeking a price-based tool without a volume-data requirement
⏺️ เหมาะกับใคร?
🔹 Trader ที่วิเคราะห์การทะลุกรอบราคา
🔹 Day trader และ Swing trader ที่ต้องการติดตามพฤติกรรมหลังทะลุ
🔹 นักวิเคราะห์ที่ใช้แนวรับ/แนวต้านร่วมกับการยืนยันด้วยราคาปิด
🔹 ผู้ใช้ที่ต้องการเครื่องมือจากราคา โดยไม่ต้องอาศัยข้อมูล Volume
⏺️ How does it work?
Calculate the highest high and lowest low of the preceding 20 bars, excluding the current bar.
Start an event when price closes above the upper boundary or below the lower boundary, provided the previous close was not already beyond that same boundary.
Freeze both boundaries and the original range width.
Observe 5 closed bars, including the breakout bar.
Count closes beyond the broken boundary and measure closing-price penetration into the range.
Only one event is tracked at a time. Additional breakout events are not started while an observation is active.
⏺️ ทำงานอย่างไร?
สร้างกรอบจาก High สูงสุดและ Low ต่ำสุดของ 20 แท่งก่อนหน้า โดยไม่รวมแท่งปัจจุบัน
เริ่มติดตามเมื่อราคาปิดทะลุขอบบนหรือขอบล่าง และราคาปิดแท่งก่อนหน้ายังไม่ได้อยู่นอกขอบเดียวกันนั้น
ล็อกขอบบน ขอบล่าง และความกว้างกรอบเดิม
ติดตาม 5 แท่งปิด โดยนับแท่งที่ทะลุเป็นแท่งแรก
นับจำนวนแท่งที่ปิดนอกกรอบ และวัดระยะที่ราคาปิดกลับเข้ากรอบ
Indicator ติดตามทีละหนึ่งเหตุการณ์ โดยไม่เริ่มเหตุการณ์ใหม่ระหว่างที่ช่วงติดตามเดิมยังทำงานอยู่
⏺️ How to read the colors
🔵 Blue — observation is in progress
🟢 Green — upward breakout meets the acceptance criteria
🔴 Red — downward breakout meets the acceptance criteria
🟡 Gold — observation ends without meeting the acceptance criteria
⚪ Gray — no event yet, or the event reaches the failure threshold
Default acceptance requires:
🔹 At least 4 out of 5 closes beyond the broken boundary
🔹 The final observation close must also remain outside
🔹 No observed close may reach the failure-depth threshold
Failure can occur before the full observation window ends.
⏺️ อ่านสีอย่างไร?
🔵 ฟ้า — กำลังติดตามหลังราคาปิดทะลุกรอบ
🟢 เขียว — ทะลุขึ้นและผ่านเกณฑ์การยืนเหนือกรอบ
🔴 แดง — ทะลุลงและผ่านเกณฑ์การยืนใต้กรอบ
🟡 ทอง — ครบช่วงติดตาม แต่ยังไม่ผ่านเกณฑ์ Acceptance
⚪ เทา — ยังไม่มีเหตุการณ์ หรือราคาปิดกลับเข้ากรอบถึงเกณฑ์ Failed
ค่าเริ่มต้นสำหรับ Acceptance:
🔹 ปิดนอกกรอบอย่างน้อย 4 จาก 5 แท่ง
🔹 แท่งสุดท้ายต้องยังปิดอยู่นอกกรอบด้านที่ทะลุ
🔹 ระหว่างติดตามต้องไม่มีราคาปิดกลับเข้ากรอบถึงเกณฑ์ Failed
สถานะ Failed สามารถเกิดขึ้นก่อนครบช่วงติดตามได้
⏺️ Understanding the measurements
Outside Closes (%) = Outside Close Count ÷ Observed Closed Bars × 100
For example, 4 outside closes out of 5 observed bars equals 80%. This is an observed frequency—not an 80% probability of continuation.
Penetration (%) = Closing-Price Return Distance ÷ Frozen Range Width × 100
🔹 Upward breakout: measure the distance the close falls below the frozen upper boundary
🔹 Downward breakout: measure the distance the close rises above the frozen lower boundary
🔹 A close outside on the breakout side has zero penetration
🔹 A close exactly on the boundary is not counted as an outside close
⏺️ ตัวเลขหมายถึงอะไร?
Outside Closes (%) = จำนวนแท่งที่ปิดนอกกรอบ ÷ จำนวนแท่งปิดที่ติดตามแล้ว × 100
ตัวอย่าง: ปิดนอกกรอบ 4 จาก 5 แท่ง เท่ากับ 80% ซึ่งเป็นสัดส่วนที่เกิดขึ้นจริงในช่วงติดตาม ไม่ใช่โอกาสไปต่อ 80%
Penetration (%) = ระยะที่ราคาปิดกลับเข้ากรอบ ÷ ความกว้างกรอบเดิม × 100
🔹 ทะลุขึ้น: วัดระยะที่ราคาปิดต่ำกว่าขอบบนเดิม
🔹 ทะลุลง: วัดระยะที่ราคาปิดสูงกว่าขอบล่างเดิม
🔹 หากยังปิดนอกกรอบด้านที่ทะลุ Penetration เท่ากับศูนย์
🔹 หากปิดตรงขอบกรอบพอดี จะไม่นับเป็นแท่งที่ปิดนอกกรอบ
ตัวอย่าง: กรอบเดิมอยู่ที่ 90–100 จุด ความกว้าง 10 จุด หากทะลุขึ้นแล้วกลับมาปิดที่ 97.5 จุด จะมี Penetration 25% และถึงเกณฑ์ Failed ตามค่าเริ่มต้น
⏺️ How to use
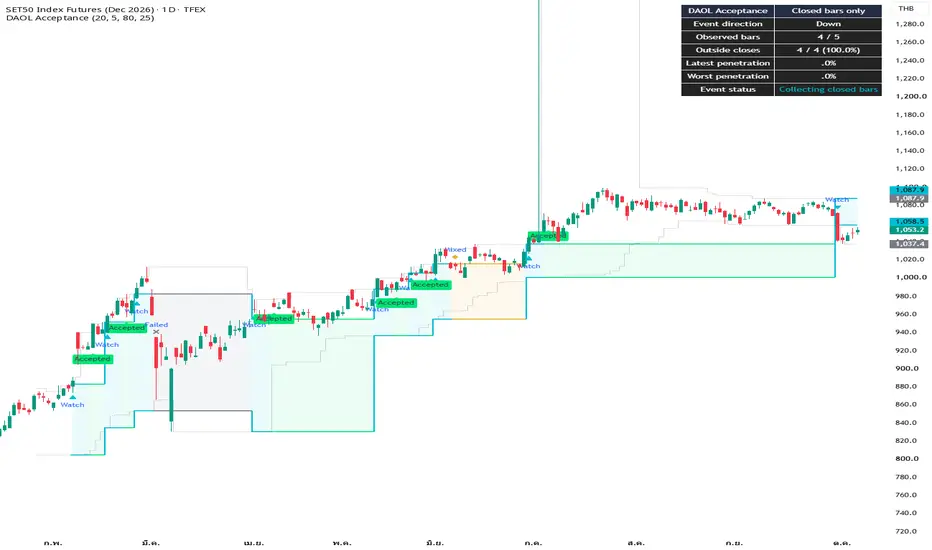
🔹 Thin gray lines — the previous rolling price range
🔹 Colored range lines — the frozen range for the tracked event
🔹 Watch markers — the start of an observation
🔹 Accepted markers — the event meets upward or downward acceptance criteria
🔹 Mixed / Failed markers — the event ends without acceptance
The dashboard displays event direction, observed bars, outside closes, latest penetration, worst penetration, and event status.
Completed results remain visible until a new event begins. They describe the completed observation window, not whether price continues to hold outside afterward.
⏺️ วิธีใช้งาน
🔹 เส้นสีเทาบาง — กรอบราคาย้อนหลังที่เลื่อนไปตามแท่งใหม่
🔹 เส้นกรอบสี — กรอบที่ล็อกไว้สำหรับเหตุการณ์ที่ติดตาม
🔹 Watch — จุดเริ่มติดตามหลังทะลุ
🔹 Accepted — ผ่านเกณฑ์ Acceptance ในทิศทางขึ้นหรือลง
🔹 Mixed / Failed — จบเหตุการณ์โดยไม่ผ่านเกณฑ์ Acceptance
Dashboard แสดงทิศทาง จำนวนแท่งที่ติดตาม จำนวนแท่งปิดนอกกรอบ ระยะกลับเข้ากรอบล่าสุด ระยะกลับเข้ากรอบมากที่สุด และสถานะเหตุการณ์
ผลที่ประเมินเสร็จจะค้างไว้จนเริ่มเหตุการณ์ใหม่ จึงเป็นผลของช่วงติดตามนั้น ไม่ใช่สถานะยืนยันว่าราคายังยืนอยู่นอกกรอบในปัจจุบัน
⏺️ Default settings
🔹 Prior Range Bars — 20
🔹 Observation Bars — 5, including the breakout bar
🔹 Minimum Outside Closes — 80%
🔹 Failure Penetration — 25% of the frozen range width
A longer observation window requires more time before classification. A higher outside-close threshold makes acceptance more demanding. A lower failure-depth threshold ends events after a shallower return into the range.
⏺️ ค่าเริ่มต้น
🔹 Prior Range Bars — 20 แท่ง
🔹 Observation Bars — 5 แท่ง รวมแท่งที่ทะลุ
🔹 Minimum Outside Closes — 80%
🔹 Failure Penetration — 25% ของความกว้างกรอบเดิม
การเพิ่มช่วงติดตามทำให้ต้องรอนานขึ้น การเพิ่มเกณฑ์ Outside Closes ทำให้ผ่าน Acceptance ยากขึ้น ส่วนการลดเกณฑ์ Failure Penetration ทำให้จบเป็น Failed เมื่อราคากลับเข้ากรอบในระยะที่ตื้นขึ้น
⏺️ Alerts
🔹 Breakout observation started
🔹 Accepted up
🔹 Accepted down
🔹 Breakout failed
🔹 Mixed result
🔹 Any event result
Event logic is evaluated on closed bars. To receive alerts, create an alert in TradingView, select the desired condition, and choose “Once Per Bar Close.”
⏺️ การแจ้งเตือน
🔹 Breakout observation started — เริ่มติดตาม
🔹 Accepted up — ทะลุขึ้นและผ่านเกณฑ์
🔹 Accepted down — ทะลุลงและผ่านเกณฑ์
🔹 Breakout failed — กลับเข้ากรอบถึงเกณฑ์ Failed
🔹 Mixed result — ครบช่วงติดตามแต่ไม่ผ่านเกณฑ์
🔹 Any event result — แจ้งผลเมื่อเหตุการณ์จบทุกประเภท
ตรรกะเหตุการณ์ประเมินเมื่อแท่งปิด หากต้องการรับ Alert ให้สร้างการแจ้งเตือนใน TradingView เลือกเงื่อนไขที่ต้องการ และตั้ง “Once Per Bar Close”
⏺️ Key Features
🔹 Previous-bar range calculation
🔹 Frozen breakout reference levels
🔹 Outside-close count and percentage
🔹 Latest and worst closing-price penetration
🔹 Early failure detection
🔹 Closed-bar event alerts
🔹 No volume requirement or multi-timeframe data requests
⏺️ จุดเด่น
🔹 สร้างกรอบจากแท่งก่อนหน้า
🔹 ล็อกระดับอ้างอิงเมื่อเกิดการทะลุ
🔹 แสดงจำนวนและสัดส่วนแท่งที่ปิดนอกกรอบ
🔹 แสดงระยะกลับเข้ากรอบล่าสุดและมากที่สุดจากราคาปิด
🔹 จบเหตุการณ์ก่อนกำหนดเมื่อถึงเกณฑ์ Failed
🔹 แจ้งเตือนเหตุการณ์จากแท่งปิด
🔹 ไม่ต้องใช้ Volume หรือข้อมูลจาก Timeframe อื่น
⏺️ Concept and attribution
The highest-high / lowest-low range is based on the Donchian Channels concept associated with Richard Donchian.
This independently written implementation adds a frozen event range, a defined observation window, outside-close counting, and closing-price penetration rules.
It does not claim that price channels or breakout confirmation are entirely new concepts.
Reference:
TradingView — Donchian Channels (DC)
tradingview.com/support/solutions/43000502253-donchian-channels-dc/
⏺️ แนวคิดและการอ้างอิง
กรอบราคาจาก High สูงสุดและ Low ต่ำสุดอ้างอิงแนวคิด Donchian Channels ของ Richard Donchian
โค้ดชุดนี้เขียนขึ้นใหม่ โดยเพิ่มการล็อกกรอบสำหรับแต่ละเหตุการณ์ ช่วงติดตามที่กำหนด การนับราคาปิดนอกกรอบ และเกณฑ์ระยะกลับเข้ากรอบจากราคาปิด
ไม่ได้อ้างว่าแนวคิดกรอบราคาหรือการยืนยัน Breakout เป็นสิ่งใหม่ทั้งหมด
⏺️ Limitations and disclaimer
🔹 Acceptance is a rule-based observation result, not a guarantee of continuation.
🔹 Confirmation introduces delay, and price may reverse after acceptance.
🔹 Penetration uses closing prices; an intrabar wick alone does not trigger failure.
🔹 Only one event is tracked at a time.
🔹 Synthetic formula and logic checks have been completed. TradingView compilation and real-market validation remain pending for this version.
🔹 For educational and informational purposes only. It does not constitute investment advice or a standalone trading system.
⏺️ ข้อจำกัดและคำชี้แจง
🔹 Acceptance เป็นผลการประเมินตามเกณฑ์ ไม่ใช่การรับประกันว่าราคาจะไปต่อ
🔹 การรอยืนยันทำให้มีความล่าช้า และราคาสามารถกลับทิศหลังผ่านเกณฑ์ได้
🔹 Penetration ใช้ราคาปิด ไส้เทียนที่กลับเข้ากรอบเพียงอย่างเดียวไม่ทำให้เกิด Failed
🔹 ติดตามทีละหนึ่งเหตุการณ์
🔹 เวอร์ชันนี้ตรวจสูตรและตรรกะด้วยข้อมูลสังเคราะห์แล้ว แต่ยังรอการ Compile ใน TradingView และตรวจสอบกับข้อมูลตลาดจริง
🔹 ใช้เพื่อการศึกษาและประกอบการวิเคราะห์ ไม่ถือเป็นคำแนะนำการลงทุนหรือระบบซื้อขายที่ใช้ได้โดยลำพัง
[DAOL] Breakout Acceptance tracks what happens after price closes above or below a previous price range.
Instead of treating every breakout as confirmation of a new trend, it observes whether subsequent closes remain outside the original range or return inside it.
🔹 Previous Range — the highest high and lowest low of the preceding N bars
🔹 Frozen Range — the original range locked when a breakout occurs
🔹 Outside Closes — the number of observed bars that close beyond the broken boundary
🔹 Penetration — how deeply a closing price returns into the frozen range
⏺️ Indicator นี้คืออะไร?
[DAOL] Breakout Acceptance คือเครื่องมือติดตามพฤติกรรมราคา หลังราคาปิดทะลุกรอบเดิม
เมื่อเกิดการทะลุ Indicator จะล็อกกรอบ ณ เวลานั้น แล้วตรวจว่าราคาปิดในแท่งถัดไปยังยืนอยู่นอกกรอบได้ หรือกลับเข้ามาภายในกรอบ
🔹 Previous Range — กรอบจาก High สูงสุดและ Low ต่ำสุดของ N แท่งก่อนหน้า
🔹 Frozen Range — กรอบเดิมที่ล็อกไว้เมื่อราคาปิดทะลุ
🔹 Outside Closes — จำนวนแท่งที่ราคาปิดอยู่นอกขอบกรอบด้านที่ทะลุ
🔹 Penetration — ระยะที่ราคาปิดกลับเข้ากรอบ เทียบกับความกว้างกรอบเดิม
⏺️ Why use Breakout Acceptance?
🔹 Adds closed-bar evidence after an initial breakout
🔹 Distinguishes persistent outside closes from repeated returns into the range
🔹 Keeps the breakout reference fixed throughout each observation event
🔹 Provides context for breakout and retest analysis
“Acceptance” is an operational classification based on the selected rules. It does not prove institutional participation or guarantee continuation.
⏺️ ทำไมต้องใช้?
🔹 ช่วยดูพฤติกรรมหลังทะลุ โดยใช้ข้อมูลจากแท่งที่ปิดแล้ว
🔹 แยกการปิดนอกกรอบอย่างต่อเนื่อง ออกจากการปิดสลับกลับเข้ากรอบ
🔹 ใช้ระดับอ้างอิงเดิมตลอดช่วงติดตามแต่ละเหตุการณ์
🔹 ใช้ประกอบการวิเคราะห์ Breakout และ Retest
คำว่า “Acceptance” ใน Indicator นี้หมายถึง ผ่านเกณฑ์การยืนราคาที่กำหนด ไม่ได้ยืนยันว่ามีแรงซื้อขายจากสถาบัน หรือรับประกันว่าราคาจะไปต่อ
⏺️ Who should use it?
🔹 Traders who analyze breakouts from recent price ranges
🔹 Day traders and swing traders monitoring post-breakout behavior
🔹 Technical analysts combining support/resistance with closing-price confirmation
🔹 Users seeking a price-based tool without a volume-data requirement
⏺️ เหมาะกับใคร?
🔹 Trader ที่วิเคราะห์การทะลุกรอบราคา
🔹 Day trader และ Swing trader ที่ต้องการติดตามพฤติกรรมหลังทะลุ
🔹 นักวิเคราะห์ที่ใช้แนวรับ/แนวต้านร่วมกับการยืนยันด้วยราคาปิด
🔹 ผู้ใช้ที่ต้องการเครื่องมือจากราคา โดยไม่ต้องอาศัยข้อมูล Volume
⏺️ How does it work?
Calculate the highest high and lowest low of the preceding 20 bars, excluding the current bar.
Start an event when price closes above the upper boundary or below the lower boundary, provided the previous close was not already beyond that same boundary.
Freeze both boundaries and the original range width.
Observe 5 closed bars, including the breakout bar.
Count closes beyond the broken boundary and measure closing-price penetration into the range.
Only one event is tracked at a time. Additional breakout events are not started while an observation is active.
⏺️ ทำงานอย่างไร?
สร้างกรอบจาก High สูงสุดและ Low ต่ำสุดของ 20 แท่งก่อนหน้า โดยไม่รวมแท่งปัจจุบัน
เริ่มติดตามเมื่อราคาปิดทะลุขอบบนหรือขอบล่าง และราคาปิดแท่งก่อนหน้ายังไม่ได้อยู่นอกขอบเดียวกันนั้น
ล็อกขอบบน ขอบล่าง และความกว้างกรอบเดิม
ติดตาม 5 แท่งปิด โดยนับแท่งที่ทะลุเป็นแท่งแรก
นับจำนวนแท่งที่ปิดนอกกรอบ และวัดระยะที่ราคาปิดกลับเข้ากรอบ
Indicator ติดตามทีละหนึ่งเหตุการณ์ โดยไม่เริ่มเหตุการณ์ใหม่ระหว่างที่ช่วงติดตามเดิมยังทำงานอยู่
⏺️ How to read the colors
🔵 Blue — observation is in progress
🟢 Green — upward breakout meets the acceptance criteria
🔴 Red — downward breakout meets the acceptance criteria
🟡 Gold — observation ends without meeting the acceptance criteria
⚪ Gray — no event yet, or the event reaches the failure threshold
Default acceptance requires:
🔹 At least 4 out of 5 closes beyond the broken boundary
🔹 The final observation close must also remain outside
🔹 No observed close may reach the failure-depth threshold
Failure can occur before the full observation window ends.
⏺️ อ่านสีอย่างไร?
🔵 ฟ้า — กำลังติดตามหลังราคาปิดทะลุกรอบ
🟢 เขียว — ทะลุขึ้นและผ่านเกณฑ์การยืนเหนือกรอบ
🔴 แดง — ทะลุลงและผ่านเกณฑ์การยืนใต้กรอบ
🟡 ทอง — ครบช่วงติดตาม แต่ยังไม่ผ่านเกณฑ์ Acceptance
⚪ เทา — ยังไม่มีเหตุการณ์ หรือราคาปิดกลับเข้ากรอบถึงเกณฑ์ Failed
ค่าเริ่มต้นสำหรับ Acceptance:
🔹 ปิดนอกกรอบอย่างน้อย 4 จาก 5 แท่ง
🔹 แท่งสุดท้ายต้องยังปิดอยู่นอกกรอบด้านที่ทะลุ
🔹 ระหว่างติดตามต้องไม่มีราคาปิดกลับเข้ากรอบถึงเกณฑ์ Failed
สถานะ Failed สามารถเกิดขึ้นก่อนครบช่วงติดตามได้
⏺️ Understanding the measurements
Outside Closes (%) = Outside Close Count ÷ Observed Closed Bars × 100
For example, 4 outside closes out of 5 observed bars equals 80%. This is an observed frequency—not an 80% probability of continuation.
Penetration (%) = Closing-Price Return Distance ÷ Frozen Range Width × 100
🔹 Upward breakout: measure the distance the close falls below the frozen upper boundary
🔹 Downward breakout: measure the distance the close rises above the frozen lower boundary
🔹 A close outside on the breakout side has zero penetration
🔹 A close exactly on the boundary is not counted as an outside close
⏺️ ตัวเลขหมายถึงอะไร?
Outside Closes (%) = จำนวนแท่งที่ปิดนอกกรอบ ÷ จำนวนแท่งปิดที่ติดตามแล้ว × 100
ตัวอย่าง: ปิดนอกกรอบ 4 จาก 5 แท่ง เท่ากับ 80% ซึ่งเป็นสัดส่วนที่เกิดขึ้นจริงในช่วงติดตาม ไม่ใช่โอกาสไปต่อ 80%
Penetration (%) = ระยะที่ราคาปิดกลับเข้ากรอบ ÷ ความกว้างกรอบเดิม × 100
🔹 ทะลุขึ้น: วัดระยะที่ราคาปิดต่ำกว่าขอบบนเดิม
🔹 ทะลุลง: วัดระยะที่ราคาปิดสูงกว่าขอบล่างเดิม
🔹 หากยังปิดนอกกรอบด้านที่ทะลุ Penetration เท่ากับศูนย์
🔹 หากปิดตรงขอบกรอบพอดี จะไม่นับเป็นแท่งที่ปิดนอกกรอบ
ตัวอย่าง: กรอบเดิมอยู่ที่ 90–100 จุด ความกว้าง 10 จุด หากทะลุขึ้นแล้วกลับมาปิดที่ 97.5 จุด จะมี Penetration 25% และถึงเกณฑ์ Failed ตามค่าเริ่มต้น
⏺️ How to use
🔹 Thin gray lines — the previous rolling price range
🔹 Colored range lines — the frozen range for the tracked event
🔹 Watch markers — the start of an observation
🔹 Accepted markers — the event meets upward or downward acceptance criteria
🔹 Mixed / Failed markers — the event ends without acceptance
The dashboard displays event direction, observed bars, outside closes, latest penetration, worst penetration, and event status.
Completed results remain visible until a new event begins. They describe the completed observation window, not whether price continues to hold outside afterward.
⏺️ วิธีใช้งาน
🔹 เส้นสีเทาบาง — กรอบราคาย้อนหลังที่เลื่อนไปตามแท่งใหม่
🔹 เส้นกรอบสี — กรอบที่ล็อกไว้สำหรับเหตุการณ์ที่ติดตาม
🔹 Watch — จุดเริ่มติดตามหลังทะลุ
🔹 Accepted — ผ่านเกณฑ์ Acceptance ในทิศทางขึ้นหรือลง
🔹 Mixed / Failed — จบเหตุการณ์โดยไม่ผ่านเกณฑ์ Acceptance
Dashboard แสดงทิศทาง จำนวนแท่งที่ติดตาม จำนวนแท่งปิดนอกกรอบ ระยะกลับเข้ากรอบล่าสุด ระยะกลับเข้ากรอบมากที่สุด และสถานะเหตุการณ์
ผลที่ประเมินเสร็จจะค้างไว้จนเริ่มเหตุการณ์ใหม่ จึงเป็นผลของช่วงติดตามนั้น ไม่ใช่สถานะยืนยันว่าราคายังยืนอยู่นอกกรอบในปัจจุบัน
⏺️ Default settings
🔹 Prior Range Bars — 20
🔹 Observation Bars — 5, including the breakout bar
🔹 Minimum Outside Closes — 80%
🔹 Failure Penetration — 25% of the frozen range width
A longer observation window requires more time before classification. A higher outside-close threshold makes acceptance more demanding. A lower failure-depth threshold ends events after a shallower return into the range.
⏺️ ค่าเริ่มต้น
🔹 Prior Range Bars — 20 แท่ง
🔹 Observation Bars — 5 แท่ง รวมแท่งที่ทะลุ
🔹 Minimum Outside Closes — 80%
🔹 Failure Penetration — 25% ของความกว้างกรอบเดิม
การเพิ่มช่วงติดตามทำให้ต้องรอนานขึ้น การเพิ่มเกณฑ์ Outside Closes ทำให้ผ่าน Acceptance ยากขึ้น ส่วนการลดเกณฑ์ Failure Penetration ทำให้จบเป็น Failed เมื่อราคากลับเข้ากรอบในระยะที่ตื้นขึ้น
⏺️ Alerts
🔹 Breakout observation started
🔹 Accepted up
🔹 Accepted down
🔹 Breakout failed
🔹 Mixed result
🔹 Any event result
Event logic is evaluated on closed bars. To receive alerts, create an alert in TradingView, select the desired condition, and choose “Once Per Bar Close.”
⏺️ การแจ้งเตือน
🔹 Breakout observation started — เริ่มติดตาม
🔹 Accepted up — ทะลุขึ้นและผ่านเกณฑ์
🔹 Accepted down — ทะลุลงและผ่านเกณฑ์
🔹 Breakout failed — กลับเข้ากรอบถึงเกณฑ์ Failed
🔹 Mixed result — ครบช่วงติดตามแต่ไม่ผ่านเกณฑ์
🔹 Any event result — แจ้งผลเมื่อเหตุการณ์จบทุกประเภท
ตรรกะเหตุการณ์ประเมินเมื่อแท่งปิด หากต้องการรับ Alert ให้สร้างการแจ้งเตือนใน TradingView เลือกเงื่อนไขที่ต้องการ และตั้ง “Once Per Bar Close”
⏺️ Key Features
🔹 Previous-bar range calculation
🔹 Frozen breakout reference levels
🔹 Outside-close count and percentage
🔹 Latest and worst closing-price penetration
🔹 Early failure detection
🔹 Closed-bar event alerts
🔹 No volume requirement or multi-timeframe data requests
⏺️ จุดเด่น
🔹 สร้างกรอบจากแท่งก่อนหน้า
🔹 ล็อกระดับอ้างอิงเมื่อเกิดการทะลุ
🔹 แสดงจำนวนและสัดส่วนแท่งที่ปิดนอกกรอบ
🔹 แสดงระยะกลับเข้ากรอบล่าสุดและมากที่สุดจากราคาปิด
🔹 จบเหตุการณ์ก่อนกำหนดเมื่อถึงเกณฑ์ Failed
🔹 แจ้งเตือนเหตุการณ์จากแท่งปิด
🔹 ไม่ต้องใช้ Volume หรือข้อมูลจาก Timeframe อื่น
⏺️ Concept and attribution
The highest-high / lowest-low range is based on the Donchian Channels concept associated with Richard Donchian.
This independently written implementation adds a frozen event range, a defined observation window, outside-close counting, and closing-price penetration rules.
It does not claim that price channels or breakout confirmation are entirely new concepts.
Reference:
TradingView — Donchian Channels (DC)
tradingview.com/support/solutions/43000502253-donchian-channels-dc/
⏺️ แนวคิดและการอ้างอิง
กรอบราคาจาก High สูงสุดและ Low ต่ำสุดอ้างอิงแนวคิด Donchian Channels ของ Richard Donchian
โค้ดชุดนี้เขียนขึ้นใหม่ โดยเพิ่มการล็อกกรอบสำหรับแต่ละเหตุการณ์ ช่วงติดตามที่กำหนด การนับราคาปิดนอกกรอบ และเกณฑ์ระยะกลับเข้ากรอบจากราคาปิด
ไม่ได้อ้างว่าแนวคิดกรอบราคาหรือการยืนยัน Breakout เป็นสิ่งใหม่ทั้งหมด
⏺️ Limitations and disclaimer
🔹 Acceptance is a rule-based observation result, not a guarantee of continuation.
🔹 Confirmation introduces delay, and price may reverse after acceptance.
🔹 Penetration uses closing prices; an intrabar wick alone does not trigger failure.
🔹 Only one event is tracked at a time.
🔹 Synthetic formula and logic checks have been completed. TradingView compilation and real-market validation remain pending for this version.
🔹 For educational and informational purposes only. It does not constitute investment advice or a standalone trading system.
⏺️ ข้อจำกัดและคำชี้แจง
🔹 Acceptance เป็นผลการประเมินตามเกณฑ์ ไม่ใช่การรับประกันว่าราคาจะไปต่อ
🔹 การรอยืนยันทำให้มีความล่าช้า และราคาสามารถกลับทิศหลังผ่านเกณฑ์ได้
🔹 Penetration ใช้ราคาปิด ไส้เทียนที่กลับเข้ากรอบเพียงอย่างเดียวไม่ทำให้เกิด Failed
🔹 ติดตามทีละหนึ่งเหตุการณ์
🔹 เวอร์ชันนี้ตรวจสูตรและตรรกะด้วยข้อมูลสังเคราะห์แล้ว แต่ยังรอการ Compile ใน TradingView และตรวจสอบกับข้อมูลตลาดจริง
🔹 ใช้เพื่อการศึกษาและประกอบการวิเคราะห์ ไม่ถือเป็นคำแนะนำการลงทุนหรือระบบซื้อขายที่ใช้ได้โดยลำพัง

Haftungsausschluss
Die Informationen und Veröffentlichungen sind nicht als Finanz-, Anlage-, Handels- oder andere Arten von Ratschlägen oder Empfehlungen gedacht, die von TradingView bereitgestellt oder gebilligt werden, und stellen diese nicht dar. Lesen Sie mehr in den Nutzungsbedingungen.
Haftungsausschluss
Die Informationen und Veröffentlichungen sind nicht als Finanz-, Anlage-, Handels- oder andere Arten von Ratschlägen oder Empfehlungen gedacht, die von TradingView bereitgestellt oder gebilligt werden, und stellen diese nicht dar. Lesen Sie mehr in den Nutzungsbedingungen.