OPEN-SOURCE SCRIPT
Motion Reversal System [BullByte]
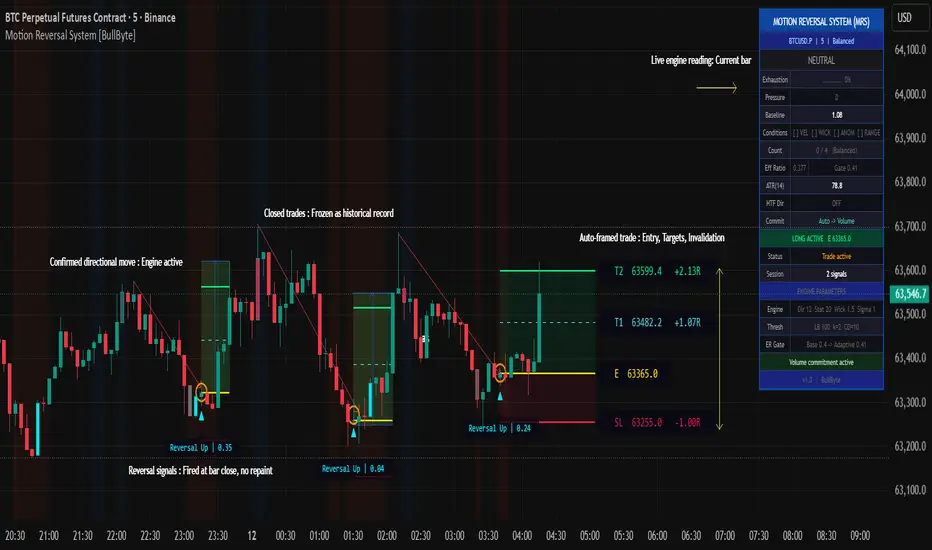
Motion Reversal System (MRS) - Trend-Failure Bar Detector with Adaptive Pressure Meter, Multi-Mode Signal Engine, and Complete Trade-Level Framework
---
Why This Indicator Exists
Most reversal indicators fall into one of two failure modes. Either they fire constantly in ranging markets because they have no directional filter, or they only confirm reversals long after price has already turned because they rely on lagging momentum oscillators. Motion Reversal System (MRS) was built to solve both problems in a single coherent engine.
MRS is one engine with one purpose: identify the precise bar at which a confirmed trend structurally fails - the moment commitment fades, the bar itself rejects further advance, and the move's energy reverses. From that bar, MRS automatically frames the trade with entry, two targets, and a stop loss, then manages the full trade lifecycle to closure.
---
What Makes This Not a Mashup
A mashup combines independent indicators that each output their own signal, then layers them visually. MRS is the opposite. Every component of MRS feeds into a single decision: "Is the current bar a trend-failure bar?" Remove any one component and the engine stops working correctly.
- The Directional Gate decides IF a trend is present (no trend = no exhaustion to detect)
- The Four Failure Conditions decide IF the current bar is structurally failing that trend
- The Signal Mode decides HOW STRICT the failure must be
- The Pressure Meter provides a live visual reading of building reversal pressure
- The Trade Level Engine decides WHERE to enter, stop, and target
- The HTF Filter decides WHETHER higher-timeframe context confirms the call
These are not independent indicators. They are stages of one detection pipeline. Each stage exists because the next stage cannot function without it.
---
The Engine - How It Actually Works
Stage 1 - Directional Gate (Kaufman Efficiency Ratio, Self-Adapting)
The script computes Kaufman's Efficiency Ratio (ER) over a rolling window. ER measures net price displacement divided by the total path price traveled. Values near 1.0 indicate pure trending motion; values near 0.0 indicate pure noise.
A fixed ER threshold would work well on one instrument and fail on another, so MRS adapts the gate dynamically. The threshold becomes the rolling mean of the ER series plus half a standard deviation, with a user-defined floor. This means the gate raises itself during volatile sessions and lowers during quiet sessions automatically. No re-tuning per instrument.
Only bars that occur inside a confirmed directional move (gate passed + minimum ATR displacement satisfied) are evaluated for failure. This single design choice eliminates the largest source of false signals: exhaustion calls in choppy ranges where there is no trend to exhaust.
Stage 2 - Four Failure Conditions (Evaluated at Bar Close)
For every bar inside a confirmed trend, MRS evaluates four orthogonal failure conditions:
C1 - Velocity Reversal: The bar closed against the direction of the confirmed trend. This is the most basic failure signal. A bull trend bar that closes red, or a bear trend bar that closes green.
C2 - Wick Rejection: The trend-side wick (upper wick in a bull trend, lower wick in a bear trend) is at least N times the size of the bar's body. This measures intra-bar rejection - buyers or sellers pushed price further in the trend direction and were defeated within the same bar.
C3 - Commitment Anomaly: The bar's commitment value (measured via volume-weighted body strength when volume is reliable, or wick-rejection ratio when it is not) is at least N standard deviations below the recent trend's commitment baseline. The current bar is statistically anomalous compared to what the trend has been producing.
C4 - Range Expansion: The bar's true range is at least N times ATR. Filters out small doji bars where wick rejection and velocity reversal become meaningless from microstructure noise.
These four conditions are orthogonal - they measure different physical properties of the bar. C1 measures direction. C2 measures intra-bar struggle. C3 measures volume/commitment. C4 measures magnitude. When multiple conditions align on the same bar, the signal reflects a greater degree of structural confluence - though no combination of conditions guarantees a reversal.
Stage 3 - Signal Mode (Strictness Selector - THE ACTUAL SIGNAL GATE)
This is the decisive gate that determines whether a signal fires. The user chooses how many of the four conditions must align:
Conservative - All 4 conditions required. Rarest signals, highest structural confluence. Best for swing traders, low-noise sessions, or those who prefer fewer signals with stronger multi-condition alignment.
Balanced (default) - Any 3 of 4 conditions required. Middle ground for most users and most timeframes. Allows one condition to be absent if the other three are strong.
Aggressive - Velocity Reversal (C1) is mandatory plus at least one other condition (minimum 2 of 4 total). Most signals, fewer conditions required per signal. Best for scalpers, active intraday traders, or those who prefer earlier detection at the cost of more false positives.
When the chosen condition count is satisfied at bar close, a signal fires. The Pressure Meter (Stage 5) is a separate visual reading and does not gate signals.
Stage 4 - Commitment Measurement (Volume-Aware with Auto Fallback)
Commitment measures how decisively the market voted on each bar. MRS supports three measurement modes:
Auto (recommended) - Uses volume-weighted commitment on instruments with real volume data (crypto, futures, stocks with traded volume). Automatically falls back to wick-rejection ratio on indices and synthetic feeds where reported volume is meaningless. The dashboard surfaces whichever method is actually active.
Volume - Forces volume-weighted measurement. Useful when you want to lock the method explicitly. Silently falls back to wick if data is missing, with a dashboard warning.
Wick - Forces wick-rejection ratio regardless of volume availability. Best for spot Gold (XAUUSD), forex, or any instrument where you don't trust the broker's volume feed.
Stage 5 - Adaptive Pressure Meter (Live Visual Reading)
The pressure meter is the dashboard's live reading of building reversal pressure. It is always populated whenever a trend is confirmed, regardless of whether the four-condition gate has been met. This gives the trader a continuous sense of how strong the reversal pressure has been building.
The meter is normalized against an adaptive baseline calculated from its own rolling history (mean + multiplier x stdev). The dashboard percentage shows where the current meter sits relative to that baseline.
Important: the baseline is a visual reference only. It does not gate signals. The signal authority is the Signal Mode condition count described in Stage 3. The meter and baseline simply help the trader monitor when conditions are increasingly aligned before they actually trigger.
Stage 6 - Higher Timeframe Confirmation (Optional Filter)
When enabled, the engine cross-checks every signal against the directional state of a higher timeframe. A reversal signal on the chart timeframe is marked "Strong" when the higher timeframe direction agrees with the chart trend being reversed against. For example: chart is in a confirmed bull move, HTF is also bullish, and a bear reversal signal fires - this is HTF-Strong, because the HTF confirms the bull trend that is being exhausted.
If the HTF direction disagrees with the chart trend (e.g., chart is in a bull move but HTF is already bearish), the signal is marked "Weak" - visually dimmed but not suppressed. The trader still sees the call but is warned that the HTF backdrop does not align with the underlying chart trend being detected.
The HTF uses request.security with lookahead = barmerge.lookahead_off, eliminating future-data leak across timeframes. The HTF series itself naturally evolves as each HTF candle forms (this is standard Pine behavior), so the script treats HTF as a confirmation filter rather than a guarantee of HTF-bar finalization. The signal trigger itself remains chart-bar-close only.
Stage 7 - Trade Level Engine (Complete Lifecycle)
When a signal fires, the engine automatically computes and draws:
- Entry: signal-bar close
- Stop Loss: fixed ATR distance from entry (not score-scaled - strong signals deserve tighter stops, not wider ones)
- Target 1: intermediate reference level, ATR distance scaled by signal strength (visual only, does not close trade)
- Target 2: decisive level, ATR distance scaled by signal strength (closes the trade on hit)
While the trade is active, four colored horizontal lines extend from the signal bar to the current bar, with monospace pill labels showing the price and R:R for each level. Two zone fills (green Entry to TP2 reward zone, red Entry to SL risk zone) make the risk/reward geometry visible at a glance.
The trade closes when either TP2 or SL is touched at bar close (intra-bar wicks that retreat before close do NOT close the trade). Same-bar TP2/SL tie is resolved as SL hit (conservative backtest assumption).
After closure, the trade-level lines freeze in place as historical record. Labels and fills vanish to keep the chart clean. The cooldown counter starts. By default, all four lines (Entry, SL, TP1, TP2) persist as historical traces for richest backtest visibility. The "Keep TP1/TP2 Historical Lines" input can be turned off to delete TP1/TP2 lines on closure and roughly double the number of historical trades the chart can hold before Pine's 500-line cap is reached.
---
Signal Timing - No Repaint
All signal generation and trade closure is gated to confirmed (closed) bars via barstate.isconfirmed.
- A reversal signal triangle and label appear only at the close of the signal bar
- Entry, SL, TP1, TP2 levels are computed from the signal bar's close
- Trade closure (TP2 / SL hit) is evaluated only after the candle finalizes - intra-bar wicks that retreat before close do not trigger closure
The trade-off is up to one bar of timing on closure for cases where price spikes through a level intra-bar and retraces. The gain is realistic backtest visuals and zero repaint at every stage of the trade lifecycle. This is an intentional architectural choice for honest behavior over flashy intra-bar firing.
---
How to Read the Chart
Signal Markers
Bull Reversal (detected inside a confirmed bear move, reversal up signaled): small cyan triangle below the bar.
Bear Reversal (detected inside a confirmed bull move, reversal down signaled): small red triangle above the bar.
Important: a bearish reversal signal fires inside a confirmed bull move. The signal detects exhaustion of the prevailing trend - not confirmation of a new one. The dashboard will show BULL MOVE while a short is active. This is correct behavior - you are trading the exhaustion of that bull move.
A monospace pill label sits beside each triangle showing the failure score (e.g., "Reversal Up | 2.45"). Higher numbers indicate stronger structural confluence across the four conditions.
When HTF Confirmation is enabled and HTF disagrees with the signal, the triangle and label appear in a dimmed color with "(HTF)" appended to the label text. The signal is still visible but is visually de-emphasized.
Trade Level Lines
Once a signal fires, four horizontal lines appear extending from the signal bar:
- Entry (yellow, solid): the price at which the signal was generated (signal-bar close)
- Target 1 (cyan, dashed): intermediate reference level, visual only
- Target 2 (green, solid): decisive level - trade closes when this is hit at bar close
- Stop Loss (red, solid): risk level - trade closes when this is hit at bar close
Pill labels at the right end of each line show the exact price and R:R distance.
Zone Fills
- Green soft fill between Entry and TP2: the reward zone
- Red soft fill between Entry and SL: the risk zone
At a glance, the green:red ratio visualizes the trade's risk-to-reward geometry.
Directional Background
- Subtle blue tint: a bull trend is confirmed
- Subtle red/orange tint: a bear trend is confirmed
- No tint: no confirmed direction (chop)
Bar Coloring (Exhaustion Gradient)
When the exhaustion meter rises above the trigger threshold (default 50% of baseline), bars are tinted on a gradient:
- Cool color (cyan/red): exhaustion is building but moderate
- Bright color (red on bull trend, cyan on bear trend): exhaustion has reached or exceeded the baseline - conditions for a signal are increasingly met, though no signal fires until the condition count gate is satisfied at bar close
Historical Trade Traces
After a trade closes, by default all four trade-level lines (Entry, SL, TP1, TP2) remain on the chart as a permanent historical record. This builds a visual log of every prior MRS detection directly on the chart. The "Keep TP1/TP2 Historical Lines" input can be turned off if you want to conserve Pine's line-object cap.
---
How to Read the Dashboard (Full Mode)
The dashboard is the live diagnostic panel. Every row tells you something specific about the current state of the engine. From top to bottom:
Row 0 - Title: "MOTION REVERSAL SYSTEM (MRS)" - confirms the indicator name.
Row 1 - Context: ticker symbol, chart timeframe, and active Signal Mode.
Row 2 - Directional State: BULL MOVE / BEAR MOVE / NEUTRAL - large text, colored. Tells you whether a confirmed trend is currently in effect. When a trade is active against the current trend (e.g., short open during a bull move), this row appends "SHORTING EXHAUSTION" or "LONGING EXHAUSTION" so the dashboard reads as a coherent statement rather than an apparent contradiction.
Row 3 - Exhaustion bar: a 10-segment text-based pressure bar with percentage. Shows how close the live meter is to the adaptive baseline. Color escalates from gray to teal to purple to bright red/cyan as pressure builds.
Row 4 - Pressure: numerical value of the live exhaustion meter.
Row 5 - Baseline: the adaptive baseline value (mean + k x stdev) the meter is compared against. Visual reference only - does not gate signals.
Row 6 - Conditions: which of the four failure conditions are currently satisfied. "[+] VEL [+] WICK [ ] ANOM [+] RANGE" means C1, C2, C4 are firing; C3 is not.
Row 7 - Count: how many of 4 conditions are firing, with current Signal Mode in parentheses. This is the actual signal authority - when the count satisfies the Signal Mode rule, a signal fires.
Row 8 - Eff Ratio: the current Kaufman Efficiency Ratio value, with the adaptive gate level next to it. Shows whether the directional gate is passing.
Row 9 - ATR: current ATR value at the configured length. Reference for understanding trade-level distances.
Row 10 - HTF Dir: current higher-timeframe directional state, OR "INVALID HTF (set higher than chart)" warning if user has misconfigured the HTF input.
Row 11 - Commit: which commitment measurement method is currently active (Auto -> Volume, Auto -> Wick fallback, etc.), with warning indicator if forced mode silently fell back.
Row 12 - Active Trade Status: "NO ACTIVE TRADE" or "LONG ACTIVE E [entry price]" / "SHORT ACTIVE E [entry price]" - color-coded.
Row 13 - Status: "Ready for signal" / "Cooldown: N bars" / "Trade active" - tells you whether the engine can fire a new signal right now.
Row 14 - Session: count of signals fired in the current session (resets daily).
Rows 15 to 19 - Engine Parameters reference: live readouts of the directional window, lookback periods, threshold parameters, ER gate values, and current commitment status. Useful for verifying your settings are applied as expected.
Row 20 - Version and Author footer.
Mobile / Minimal Dashboard Mode
For phone and tablet users, switching "Dashboard Mode" to "Minimal (Mobile)" collapses the dashboard to a single-column 5-row compact layout with larger fonts: Title, State, Exhaustion, Conditions, and Trade Status. Diagnostics are hidden for screen-space efficiency.
---
Default Settings Explained
- Directional Window: 12 bars - measures Efficiency Ratio over a 12-bar lookback
- Directional Threshold (Base): 0.40 - minimum ER for trend confirmation, adapted upward dynamically
- Min Move Size: 1.5 ATR - net displacement must be at least 1.5 ATR for a trend to qualify
- Trend Statistics Lookback: 20 bars - sample size for computing commitment baseline statistics
- Wick Rejection Ratio: 1.5 - trend-side wick must be at least 1.5x the body to count as rejection
- Commitment Anomaly Sigma: 1.0 - current commitment must be at least 1.0 standard deviation below trend mean
- Min Range Expansion: 1.2 ATR - current bar range must be at least 1.2x ATR
- Signal Mode: Balanced - any 3 of 4 conditions required
- Baseline Lookback: 100 bars - rolling history for pressure meter statistics
- Baseline Multiplier: 2.0 - baseline = mean + 2.0 x stdev
- ATR Length: 14 - standard ATR period
- Commitment Mode: Auto - volume on real-volume instruments, wick on indices
- Post-Closure Cooldown: 10 bars - wait 10 bars after trade closure before new signal
- Stop Loss Distance: 1.5 ATR - base SL distance from entry
- Target 1 Distance: 1.5 ATR - T1 at 1:1 with SL
- Target 2 Distance: 3.0 ATR - T2 at 1:2 with SL
- Score-Weight Nudge: 0.3 - stronger signals widen targets by up to 30%
- Min Label Spacing: 0.35 ATR - minimum vertical gap between pill labels for readability
---
Recommended Usage by Trader Profile
Scalper (1m to 5m): Aggressive mode, Cooldown 5 to 8 bars, HTF Confirmation on 15m. Signal frequency will be higher in Aggressive mode; use the dashboard pressure meter to monitor building exhaustion between signals.
Intraday Trader (5m to 30m): Balanced mode (default), Cooldown 10 bars, HTF Confirmation on 1h to 4h. The default settings were designed with this profile in mind as a starting reference point.
Swing Trader (1h to 4h): Conservative mode, Cooldown 15 to 20 bars, HTF Confirmation on Daily. Few signals, maximum condition confluence required.
Position Trader (Daily and above): Conservative mode, HTF Confirmation on Weekly. Signals are rare; when they fire, all four structural failure conditions have aligned on a higher timeframe bar.
---
Recommended Markets
- Crypto (Spot and Perpetuals): well-suited - high volume data availability, clean microstructure, MRS auto-selects volume-weighted commitment
- Index Futures (NQ, ES, NIFTY futures): well-suited - real traded volume available, strong directional character
- FX Majors: usable with Wick commitment mode forced (broker volume is unreliable)
- Spot Gold (XAUUSD): use Wick mode explicitly - most brokers report tick count as volume which is meaningless
- Cash Indices (NIFTY, SPX index): MRS auto-detects index type and routes to Wick mode; verify Commit row on dashboard
---
A Real-World Example Walkthrough
This walkthrough is a constructed illustration of how the engine behaves. It does not represent a historical trade or a performance result.
Scenario: BTCUSDT 15m chart, Balanced mode, Auto commitment.
Bars 1 to 20: Price climbs in a steady bull move. Dashboard shows BULL MOVE, Efficiency Ratio 0.55, Pressure Meter 0.20 (low). No signals fire because exhaustion is not building.
Bar 21: A large green candle prints - Range Expansion (C4) fires but the bar closes strong (no Velocity Reversal C1), and commitment is normal (no C3). Only 1 of 4 conditions. No signal.
Bars 22 to 24: Three smaller green bars with shrinking bodies. The Pressure Meter ticks up to 0.55 (moderate). Bar coloring activates softly. Dashboard "Conditions" row shows [ ] [+] [ ] [ ] - only Wick Rejection is firing intermittently. No signal yet.
Bar 25: A red bar prints with a long upper wick and large range. All four conditions fire:
- C1 Velocity Reversal: bar closed red (against bull trend)
- C2 Wick Rejection: upper wick is 1.8x the body
- C3 Commitment Anomaly: bar's commitment is 1.4 standard deviations below the trend baseline
- C4 Range Expansion: bar range is 1.6x ATR
Dashboard shows "Conditions: [+] VEL [+] WICK [+] ANOM [+] RANGE | Count: 4/4". Pressure Meter reads 1.15.
A red bear reversal triangle prints above the bar with the label "Reversal Down | 3.42". Trade-level lines automatically draw:
- Entry (yellow): 64,210.50 (signal-bar close)
- SL (red): 64,422.00 (1.5 ATR above entry, since this is a short)
- T1 (cyan dashed): 63,999.00 (1.5 ATR x score-scale below entry)
- T2 (green): 63,576.00 (3.0 ATR x score-scale below entry)
Green reward fill appears Entry to T2, red risk fill Entry to SL. Dashboard "Active Trade" row turns red: "SHORT ACTIVE E 64,210.50". Dashboard "Directional State" row reads: "BULL MOVE | SHORTING EXHAUSTION".
Over the next several bars, price drops. The trade-level lines extend bar-by-bar. Dashboard "Status" reads "Trade active". No new signals fire because one trade is already open.
Bar 32: In this example, price reaches T2 at 63,576.00 on this bar's close. The trade closes at the target level. Labels and zone fills vanish. The trade-level lines freeze at bar 32 as historical record. Dashboard "Status" switches to "Cooldown: 10 bars".
Bars 33 to 42: Cooldown period. No new signals possible.
Bar 43: Cooldown complete. Dashboard "Status" reads "Ready for signal". The engine will evaluate the next qualifying bar for failure conditions.
---
Chart Examples
These screenshots show the indicator in use at specific moments in time. They are provided for visual reference only and do not represent performance results or forward-looking outcomes.
1. MRS detected a trend-failure bar inside a confirmed bull move on BTCUSDT 5m. Range expansion (C4) fired as exhaustion pressure reached the adaptive baseline (1.28 vs 1.03). Balanced mode gated the short at bar close - entry 62,553.3, SL 62,681.9, T2 62,273.6 (T2 distance: 2.17R).

2. MRS detected a trend-failure bar at the low of a confirmed bear move on NQ1! 5m. As the engine tracked displacement against path length (ER), exhaustion pressure crossed the adaptive baseline - failure score 0.48. Balanced mode gated the long at bar close - entry 30,553.75, SL 30,489.00, T2 30,706.50 (T2 distance: 2.36R).

---
Parameter Adjustment Guide
If you get too few signals:
- Switch Signal Mode to Aggressive
- Lower Wick Rejection Ratio (1.0 to 1.2)
- Lower Commitment Anomaly Sigma (0.7 to 0.9)
- Lower Min Range Expansion (1.0 to 1.1)
- Reduce Cooldown to 5
If you get too many false signals:
- Switch Signal Mode to Conservative
- Raise Wick Rejection Ratio (2.0 to 2.5)
- Raise Commitment Anomaly Sigma (1.3 to 2.0)
- Raise Min Range Expansion (1.5 to 2.0)
- Enable HTF Confirmation
- Raise Cooldown to 15 to 20
If the T2 zone is reached but price reverses sharply before bar close triggers closure:
- Reduce T2 Distance to 2.0 to 2.5 ATR
- Reduce Score-Weight Nudge to 0.1 (less target widening on strong signals)
If SL is hit too often:
- Increase Stop Loss Distance to 2.0 ATR
- Increase T1 and T2 proportionally to maintain R:R geometry
---
What This Indicator Does Not Do
- It does not execute trades. It is an indicator (overlay), not a strategy. Order placement and trade management decisions remain with the user.
- It does not predict the future. It identifies bars where a confirmed trend has structurally failed based on objective criteria.
- It does not eliminate losses. False signals will occur, especially in news-driven price spikes. Always size positions according to your own risk management rules.
- It does not work on every instrument equally well. Choppy low-liquidity assets produce noisier signals. Test on your specific market before relying on it.
- It does not replace discretionary judgment. Use MRS as one input in your decision process, not the only input.
---
Alerts Available
---
Disclaimer
This script is provided for educational and analytical purposes only. It is not financial advice, an investment recommendation, or a solicitation to trade. Past performance of any indicator or strategy does not guarantee future results. Trading involves substantial risk of loss. The author and TradingView are not liable for any losses or damages arising from use of this script. Always validate signals against your own analysis, conduct your own due diligence, and apply prudent risk management. Use at your own risk.
---
Open source under Mozilla Public License 2.0. Code is fully readable in the Pine Editor for those who want to study the math. Thank you.
- BullByte
---
Why This Indicator Exists
Most reversal indicators fall into one of two failure modes. Either they fire constantly in ranging markets because they have no directional filter, or they only confirm reversals long after price has already turned because they rely on lagging momentum oscillators. Motion Reversal System (MRS) was built to solve both problems in a single coherent engine.
MRS is one engine with one purpose: identify the precise bar at which a confirmed trend structurally fails - the moment commitment fades, the bar itself rejects further advance, and the move's energy reverses. From that bar, MRS automatically frames the trade with entry, two targets, and a stop loss, then manages the full trade lifecycle to closure.
---
What Makes This Not a Mashup
A mashup combines independent indicators that each output their own signal, then layers them visually. MRS is the opposite. Every component of MRS feeds into a single decision: "Is the current bar a trend-failure bar?" Remove any one component and the engine stops working correctly.
- The Directional Gate decides IF a trend is present (no trend = no exhaustion to detect)
- The Four Failure Conditions decide IF the current bar is structurally failing that trend
- The Signal Mode decides HOW STRICT the failure must be
- The Pressure Meter provides a live visual reading of building reversal pressure
- The Trade Level Engine decides WHERE to enter, stop, and target
- The HTF Filter decides WHETHER higher-timeframe context confirms the call
These are not independent indicators. They are stages of one detection pipeline. Each stage exists because the next stage cannot function without it.
---
The Engine - How It Actually Works
Stage 1 - Directional Gate (Kaufman Efficiency Ratio, Self-Adapting)
The script computes Kaufman's Efficiency Ratio (ER) over a rolling window. ER measures net price displacement divided by the total path price traveled. Values near 1.0 indicate pure trending motion; values near 0.0 indicate pure noise.
A fixed ER threshold would work well on one instrument and fail on another, so MRS adapts the gate dynamically. The threshold becomes the rolling mean of the ER series plus half a standard deviation, with a user-defined floor. This means the gate raises itself during volatile sessions and lowers during quiet sessions automatically. No re-tuning per instrument.
Only bars that occur inside a confirmed directional move (gate passed + minimum ATR displacement satisfied) are evaluated for failure. This single design choice eliminates the largest source of false signals: exhaustion calls in choppy ranges where there is no trend to exhaust.
Stage 2 - Four Failure Conditions (Evaluated at Bar Close)
For every bar inside a confirmed trend, MRS evaluates four orthogonal failure conditions:
C1 - Velocity Reversal: The bar closed against the direction of the confirmed trend. This is the most basic failure signal. A bull trend bar that closes red, or a bear trend bar that closes green.
C2 - Wick Rejection: The trend-side wick (upper wick in a bull trend, lower wick in a bear trend) is at least N times the size of the bar's body. This measures intra-bar rejection - buyers or sellers pushed price further in the trend direction and were defeated within the same bar.
C3 - Commitment Anomaly: The bar's commitment value (measured via volume-weighted body strength when volume is reliable, or wick-rejection ratio when it is not) is at least N standard deviations below the recent trend's commitment baseline. The current bar is statistically anomalous compared to what the trend has been producing.
C4 - Range Expansion: The bar's true range is at least N times ATR. Filters out small doji bars where wick rejection and velocity reversal become meaningless from microstructure noise.
These four conditions are orthogonal - they measure different physical properties of the bar. C1 measures direction. C2 measures intra-bar struggle. C3 measures volume/commitment. C4 measures magnitude. When multiple conditions align on the same bar, the signal reflects a greater degree of structural confluence - though no combination of conditions guarantees a reversal.
Stage 3 - Signal Mode (Strictness Selector - THE ACTUAL SIGNAL GATE)
This is the decisive gate that determines whether a signal fires. The user chooses how many of the four conditions must align:
Conservative - All 4 conditions required. Rarest signals, highest structural confluence. Best for swing traders, low-noise sessions, or those who prefer fewer signals with stronger multi-condition alignment.
Balanced (default) - Any 3 of 4 conditions required. Middle ground for most users and most timeframes. Allows one condition to be absent if the other three are strong.
Aggressive - Velocity Reversal (C1) is mandatory plus at least one other condition (minimum 2 of 4 total). Most signals, fewer conditions required per signal. Best for scalpers, active intraday traders, or those who prefer earlier detection at the cost of more false positives.
When the chosen condition count is satisfied at bar close, a signal fires. The Pressure Meter (Stage 5) is a separate visual reading and does not gate signals.
Stage 4 - Commitment Measurement (Volume-Aware with Auto Fallback)
Commitment measures how decisively the market voted on each bar. MRS supports three measurement modes:
Auto (recommended) - Uses volume-weighted commitment on instruments with real volume data (crypto, futures, stocks with traded volume). Automatically falls back to wick-rejection ratio on indices and synthetic feeds where reported volume is meaningless. The dashboard surfaces whichever method is actually active.
Volume - Forces volume-weighted measurement. Useful when you want to lock the method explicitly. Silently falls back to wick if data is missing, with a dashboard warning.
Wick - Forces wick-rejection ratio regardless of volume availability. Best for spot Gold (XAUUSD), forex, or any instrument where you don't trust the broker's volume feed.
Stage 5 - Adaptive Pressure Meter (Live Visual Reading)
The pressure meter is the dashboard's live reading of building reversal pressure. It is always populated whenever a trend is confirmed, regardless of whether the four-condition gate has been met. This gives the trader a continuous sense of how strong the reversal pressure has been building.
The meter is normalized against an adaptive baseline calculated from its own rolling history (mean + multiplier x stdev). The dashboard percentage shows where the current meter sits relative to that baseline.
Important: the baseline is a visual reference only. It does not gate signals. The signal authority is the Signal Mode condition count described in Stage 3. The meter and baseline simply help the trader monitor when conditions are increasingly aligned before they actually trigger.
Stage 6 - Higher Timeframe Confirmation (Optional Filter)
When enabled, the engine cross-checks every signal against the directional state of a higher timeframe. A reversal signal on the chart timeframe is marked "Strong" when the higher timeframe direction agrees with the chart trend being reversed against. For example: chart is in a confirmed bull move, HTF is also bullish, and a bear reversal signal fires - this is HTF-Strong, because the HTF confirms the bull trend that is being exhausted.
If the HTF direction disagrees with the chart trend (e.g., chart is in a bull move but HTF is already bearish), the signal is marked "Weak" - visually dimmed but not suppressed. The trader still sees the call but is warned that the HTF backdrop does not align with the underlying chart trend being detected.
The HTF uses request.security with lookahead = barmerge.lookahead_off, eliminating future-data leak across timeframes. The HTF series itself naturally evolves as each HTF candle forms (this is standard Pine behavior), so the script treats HTF as a confirmation filter rather than a guarantee of HTF-bar finalization. The signal trigger itself remains chart-bar-close only.
Stage 7 - Trade Level Engine (Complete Lifecycle)
When a signal fires, the engine automatically computes and draws:
- Entry: signal-bar close
- Stop Loss: fixed ATR distance from entry (not score-scaled - strong signals deserve tighter stops, not wider ones)
- Target 1: intermediate reference level, ATR distance scaled by signal strength (visual only, does not close trade)
- Target 2: decisive level, ATR distance scaled by signal strength (closes the trade on hit)
While the trade is active, four colored horizontal lines extend from the signal bar to the current bar, with monospace pill labels showing the price and R:R for each level. Two zone fills (green Entry to TP2 reward zone, red Entry to SL risk zone) make the risk/reward geometry visible at a glance.
The trade closes when either TP2 or SL is touched at bar close (intra-bar wicks that retreat before close do NOT close the trade). Same-bar TP2/SL tie is resolved as SL hit (conservative backtest assumption).
After closure, the trade-level lines freeze in place as historical record. Labels and fills vanish to keep the chart clean. The cooldown counter starts. By default, all four lines (Entry, SL, TP1, TP2) persist as historical traces for richest backtest visibility. The "Keep TP1/TP2 Historical Lines" input can be turned off to delete TP1/TP2 lines on closure and roughly double the number of historical trades the chart can hold before Pine's 500-line cap is reached.
---
Signal Timing - No Repaint
All signal generation and trade closure is gated to confirmed (closed) bars via barstate.isconfirmed.
- A reversal signal triangle and label appear only at the close of the signal bar
- Entry, SL, TP1, TP2 levels are computed from the signal bar's close
- Trade closure (TP2 / SL hit) is evaluated only after the candle finalizes - intra-bar wicks that retreat before close do not trigger closure
The trade-off is up to one bar of timing on closure for cases where price spikes through a level intra-bar and retraces. The gain is realistic backtest visuals and zero repaint at every stage of the trade lifecycle. This is an intentional architectural choice for honest behavior over flashy intra-bar firing.
---
How to Read the Chart
Signal Markers
Bull Reversal (detected inside a confirmed bear move, reversal up signaled): small cyan triangle below the bar.
Bear Reversal (detected inside a confirmed bull move, reversal down signaled): small red triangle above the bar.
Important: a bearish reversal signal fires inside a confirmed bull move. The signal detects exhaustion of the prevailing trend - not confirmation of a new one. The dashboard will show BULL MOVE while a short is active. This is correct behavior - you are trading the exhaustion of that bull move.
A monospace pill label sits beside each triangle showing the failure score (e.g., "Reversal Up | 2.45"). Higher numbers indicate stronger structural confluence across the four conditions.
When HTF Confirmation is enabled and HTF disagrees with the signal, the triangle and label appear in a dimmed color with "(HTF)" appended to the label text. The signal is still visible but is visually de-emphasized.
Trade Level Lines
Once a signal fires, four horizontal lines appear extending from the signal bar:
- Entry (yellow, solid): the price at which the signal was generated (signal-bar close)
- Target 1 (cyan, dashed): intermediate reference level, visual only
- Target 2 (green, solid): decisive level - trade closes when this is hit at bar close
- Stop Loss (red, solid): risk level - trade closes when this is hit at bar close
Pill labels at the right end of each line show the exact price and R:R distance.
Zone Fills
- Green soft fill between Entry and TP2: the reward zone
- Red soft fill between Entry and SL: the risk zone
At a glance, the green:red ratio visualizes the trade's risk-to-reward geometry.
Directional Background
- Subtle blue tint: a bull trend is confirmed
- Subtle red/orange tint: a bear trend is confirmed
- No tint: no confirmed direction (chop)
Bar Coloring (Exhaustion Gradient)
When the exhaustion meter rises above the trigger threshold (default 50% of baseline), bars are tinted on a gradient:
- Cool color (cyan/red): exhaustion is building but moderate
- Bright color (red on bull trend, cyan on bear trend): exhaustion has reached or exceeded the baseline - conditions for a signal are increasingly met, though no signal fires until the condition count gate is satisfied at bar close
Historical Trade Traces
After a trade closes, by default all four trade-level lines (Entry, SL, TP1, TP2) remain on the chart as a permanent historical record. This builds a visual log of every prior MRS detection directly on the chart. The "Keep TP1/TP2 Historical Lines" input can be turned off if you want to conserve Pine's line-object cap.
---
How to Read the Dashboard (Full Mode)
The dashboard is the live diagnostic panel. Every row tells you something specific about the current state of the engine. From top to bottom:
Row 0 - Title: "MOTION REVERSAL SYSTEM (MRS)" - confirms the indicator name.
Row 1 - Context: ticker symbol, chart timeframe, and active Signal Mode.
Row 2 - Directional State: BULL MOVE / BEAR MOVE / NEUTRAL - large text, colored. Tells you whether a confirmed trend is currently in effect. When a trade is active against the current trend (e.g., short open during a bull move), this row appends "SHORTING EXHAUSTION" or "LONGING EXHAUSTION" so the dashboard reads as a coherent statement rather than an apparent contradiction.
Row 3 - Exhaustion bar: a 10-segment text-based pressure bar with percentage. Shows how close the live meter is to the adaptive baseline. Color escalates from gray to teal to purple to bright red/cyan as pressure builds.
Row 4 - Pressure: numerical value of the live exhaustion meter.
Row 5 - Baseline: the adaptive baseline value (mean + k x stdev) the meter is compared against. Visual reference only - does not gate signals.
Row 6 - Conditions: which of the four failure conditions are currently satisfied. "[+] VEL [+] WICK [ ] ANOM [+] RANGE" means C1, C2, C4 are firing; C3 is not.
Row 7 - Count: how many of 4 conditions are firing, with current Signal Mode in parentheses. This is the actual signal authority - when the count satisfies the Signal Mode rule, a signal fires.
Row 8 - Eff Ratio: the current Kaufman Efficiency Ratio value, with the adaptive gate level next to it. Shows whether the directional gate is passing.
Row 9 - ATR: current ATR value at the configured length. Reference for understanding trade-level distances.
Row 10 - HTF Dir: current higher-timeframe directional state, OR "INVALID HTF (set higher than chart)" warning if user has misconfigured the HTF input.
Row 11 - Commit: which commitment measurement method is currently active (Auto -> Volume, Auto -> Wick fallback, etc.), with warning indicator if forced mode silently fell back.
Row 12 - Active Trade Status: "NO ACTIVE TRADE" or "LONG ACTIVE E [entry price]" / "SHORT ACTIVE E [entry price]" - color-coded.
Row 13 - Status: "Ready for signal" / "Cooldown: N bars" / "Trade active" - tells you whether the engine can fire a new signal right now.
Row 14 - Session: count of signals fired in the current session (resets daily).
Rows 15 to 19 - Engine Parameters reference: live readouts of the directional window, lookback periods, threshold parameters, ER gate values, and current commitment status. Useful for verifying your settings are applied as expected.
Row 20 - Version and Author footer.
Mobile / Minimal Dashboard Mode
For phone and tablet users, switching "Dashboard Mode" to "Minimal (Mobile)" collapses the dashboard to a single-column 5-row compact layout with larger fonts: Title, State, Exhaustion, Conditions, and Trade Status. Diagnostics are hidden for screen-space efficiency.
---
Default Settings Explained
- Directional Window: 12 bars - measures Efficiency Ratio over a 12-bar lookback
- Directional Threshold (Base): 0.40 - minimum ER for trend confirmation, adapted upward dynamically
- Min Move Size: 1.5 ATR - net displacement must be at least 1.5 ATR for a trend to qualify
- Trend Statistics Lookback: 20 bars - sample size for computing commitment baseline statistics
- Wick Rejection Ratio: 1.5 - trend-side wick must be at least 1.5x the body to count as rejection
- Commitment Anomaly Sigma: 1.0 - current commitment must be at least 1.0 standard deviation below trend mean
- Min Range Expansion: 1.2 ATR - current bar range must be at least 1.2x ATR
- Signal Mode: Balanced - any 3 of 4 conditions required
- Baseline Lookback: 100 bars - rolling history for pressure meter statistics
- Baseline Multiplier: 2.0 - baseline = mean + 2.0 x stdev
- ATR Length: 14 - standard ATR period
- Commitment Mode: Auto - volume on real-volume instruments, wick on indices
- Post-Closure Cooldown: 10 bars - wait 10 bars after trade closure before new signal
- Stop Loss Distance: 1.5 ATR - base SL distance from entry
- Target 1 Distance: 1.5 ATR - T1 at 1:1 with SL
- Target 2 Distance: 3.0 ATR - T2 at 1:2 with SL
- Score-Weight Nudge: 0.3 - stronger signals widen targets by up to 30%
- Min Label Spacing: 0.35 ATR - minimum vertical gap between pill labels for readability
---
Recommended Usage by Trader Profile
Scalper (1m to 5m): Aggressive mode, Cooldown 5 to 8 bars, HTF Confirmation on 15m. Signal frequency will be higher in Aggressive mode; use the dashboard pressure meter to monitor building exhaustion between signals.
Intraday Trader (5m to 30m): Balanced mode (default), Cooldown 10 bars, HTF Confirmation on 1h to 4h. The default settings were designed with this profile in mind as a starting reference point.
Swing Trader (1h to 4h): Conservative mode, Cooldown 15 to 20 bars, HTF Confirmation on Daily. Few signals, maximum condition confluence required.
Position Trader (Daily and above): Conservative mode, HTF Confirmation on Weekly. Signals are rare; when they fire, all four structural failure conditions have aligned on a higher timeframe bar.
---
Recommended Markets
- Crypto (Spot and Perpetuals): well-suited - high volume data availability, clean microstructure, MRS auto-selects volume-weighted commitment
- Index Futures (NQ, ES, NIFTY futures): well-suited - real traded volume available, strong directional character
- FX Majors: usable with Wick commitment mode forced (broker volume is unreliable)
- Spot Gold (XAUUSD): use Wick mode explicitly - most brokers report tick count as volume which is meaningless
- Cash Indices (NIFTY, SPX index): MRS auto-detects index type and routes to Wick mode; verify Commit row on dashboard
---
A Real-World Example Walkthrough
This walkthrough is a constructed illustration of how the engine behaves. It does not represent a historical trade or a performance result.
Scenario: BTCUSDT 15m chart, Balanced mode, Auto commitment.
Bars 1 to 20: Price climbs in a steady bull move. Dashboard shows BULL MOVE, Efficiency Ratio 0.55, Pressure Meter 0.20 (low). No signals fire because exhaustion is not building.
Bar 21: A large green candle prints - Range Expansion (C4) fires but the bar closes strong (no Velocity Reversal C1), and commitment is normal (no C3). Only 1 of 4 conditions. No signal.
Bars 22 to 24: Three smaller green bars with shrinking bodies. The Pressure Meter ticks up to 0.55 (moderate). Bar coloring activates softly. Dashboard "Conditions" row shows [ ] [+] [ ] [ ] - only Wick Rejection is firing intermittently. No signal yet.
Bar 25: A red bar prints with a long upper wick and large range. All four conditions fire:
- C1 Velocity Reversal: bar closed red (against bull trend)
- C2 Wick Rejection: upper wick is 1.8x the body
- C3 Commitment Anomaly: bar's commitment is 1.4 standard deviations below the trend baseline
- C4 Range Expansion: bar range is 1.6x ATR
Dashboard shows "Conditions: [+] VEL [+] WICK [+] ANOM [+] RANGE | Count: 4/4". Pressure Meter reads 1.15.
A red bear reversal triangle prints above the bar with the label "Reversal Down | 3.42". Trade-level lines automatically draw:
- Entry (yellow): 64,210.50 (signal-bar close)
- SL (red): 64,422.00 (1.5 ATR above entry, since this is a short)
- T1 (cyan dashed): 63,999.00 (1.5 ATR x score-scale below entry)
- T2 (green): 63,576.00 (3.0 ATR x score-scale below entry)
Green reward fill appears Entry to T2, red risk fill Entry to SL. Dashboard "Active Trade" row turns red: "SHORT ACTIVE E 64,210.50". Dashboard "Directional State" row reads: "BULL MOVE | SHORTING EXHAUSTION".
Over the next several bars, price drops. The trade-level lines extend bar-by-bar. Dashboard "Status" reads "Trade active". No new signals fire because one trade is already open.
Bar 32: In this example, price reaches T2 at 63,576.00 on this bar's close. The trade closes at the target level. Labels and zone fills vanish. The trade-level lines freeze at bar 32 as historical record. Dashboard "Status" switches to "Cooldown: 10 bars".
Bars 33 to 42: Cooldown period. No new signals possible.
Bar 43: Cooldown complete. Dashboard "Status" reads "Ready for signal". The engine will evaluate the next qualifying bar for failure conditions.
---
Chart Examples
These screenshots show the indicator in use at specific moments in time. They are provided for visual reference only and do not represent performance results or forward-looking outcomes.
1. MRS detected a trend-failure bar inside a confirmed bull move on BTCUSDT 5m. Range expansion (C4) fired as exhaustion pressure reached the adaptive baseline (1.28 vs 1.03). Balanced mode gated the short at bar close - entry 62,553.3, SL 62,681.9, T2 62,273.6 (T2 distance: 2.17R).
2. MRS detected a trend-failure bar at the low of a confirmed bear move on NQ1! 5m. As the engine tracked displacement against path length (ER), exhaustion pressure crossed the adaptive baseline - failure score 0.48. Balanced mode gated the long at bar close - entry 30,553.75, SL 30,489.00, T2 30,706.50 (T2 distance: 2.36R).
---
Parameter Adjustment Guide
If you get too few signals:
- Switch Signal Mode to Aggressive
- Lower Wick Rejection Ratio (1.0 to 1.2)
- Lower Commitment Anomaly Sigma (0.7 to 0.9)
- Lower Min Range Expansion (1.0 to 1.1)
- Reduce Cooldown to 5
If you get too many false signals:
- Switch Signal Mode to Conservative
- Raise Wick Rejection Ratio (2.0 to 2.5)
- Raise Commitment Anomaly Sigma (1.3 to 2.0)
- Raise Min Range Expansion (1.5 to 2.0)
- Enable HTF Confirmation
- Raise Cooldown to 15 to 20
If the T2 zone is reached but price reverses sharply before bar close triggers closure:
- Reduce T2 Distance to 2.0 to 2.5 ATR
- Reduce Score-Weight Nudge to 0.1 (less target widening on strong signals)
If SL is hit too often:
- Increase Stop Loss Distance to 2.0 ATR
- Increase T1 and T2 proportionally to maintain R:R geometry
---
What This Indicator Does Not Do
- It does not execute trades. It is an indicator (overlay), not a strategy. Order placement and trade management decisions remain with the user.
- It does not predict the future. It identifies bars where a confirmed trend has structurally failed based on objective criteria.
- It does not eliminate losses. False signals will occur, especially in news-driven price spikes. Always size positions according to your own risk management rules.
- It does not work on every instrument equally well. Choppy low-liquidity assets produce noisier signals. Test on your specific market before relying on it.
- It does not replace discretionary judgment. Use MRS as one input in your decision process, not the only input.
---
Alerts Available
- MRS Bull Reversal (Strong) - bullish reversal signal; HTF confirms the preceding bear trend
- MRS Bull Reversal (HTF Weak) - bullish reversal signal; HTF does not confirm the preceding bear trend
- MRS Bear Reversal (Strong) - bearish reversal signal; HTF confirms the preceding bull trend
- MRS Bear Reversal (HTF Weak) - bearish reversal signal; HTF does not confirm the preceding bull trend
- MRS Target 2 Hit - trade closure at T2 level
- MRS Stop Loss Hit - trade closure at SL level
---
Disclaimer
This script is provided for educational and analytical purposes only. It is not financial advice, an investment recommendation, or a solicitation to trade. Past performance of any indicator or strategy does not guarantee future results. Trading involves substantial risk of loss. The author and TradingView are not liable for any losses or damages arising from use of this script. Always validate signals against your own analysis, conduct your own due diligence, and apply prudent risk management. Use at your own risk.
---
Open source under Mozilla Public License 2.0. Code is fully readable in the Pine Editor for those who want to study the math. Thank you.
- BullByte
Open-source Skript
Ganz im Sinne von TradingView hat dieser Autor sein/ihr Script als Open-Source veröffentlicht. Auf diese Weise können nun auch andere Trader das Script rezensieren und die Funktionalität überprüfen. Vielen Dank an den Autor! Sie können das Script kostenlos verwenden, aber eine Wiederveröffentlichung des Codes unterliegt unseren Hausregeln.

💎 BullByte Top Tools | Paid Space : in.tradingview.com/spaces/BullByte/
💬 Join the community: Telegram
t.me/BullByteTradingLab
💬 Join the community: Telegram
t.me/BullByteTradingLab
Haftungsausschluss
Die Informationen und Veröffentlichungen sind nicht als Finanz-, Anlage-, Handels- oder andere Arten von Ratschlägen oder Empfehlungen gedacht, die von TradingView bereitgestellt oder gebilligt werden, und stellen diese nicht dar. Lesen Sie mehr in den Nutzungsbedingungen.
Open-source Skript
Ganz im Sinne von TradingView hat dieser Autor sein/ihr Script als Open-Source veröffentlicht. Auf diese Weise können nun auch andere Trader das Script rezensieren und die Funktionalität überprüfen. Vielen Dank an den Autor! Sie können das Script kostenlos verwenden, aber eine Wiederveröffentlichung des Codes unterliegt unseren Hausregeln.
💎 BullByte Top Tools | Paid Space : in.tradingview.com/spaces/BullByte/
💬 Join the community: Telegram
t.me/BullByteTradingLab
💬 Join the community: Telegram
t.me/BullByteTradingLab
Haftungsausschluss
Die Informationen und Veröffentlichungen sind nicht als Finanz-, Anlage-, Handels- oder andere Arten von Ratschlägen oder Empfehlungen gedacht, die von TradingView bereitgestellt oder gebilligt werden, und stellen diese nicht dar. Lesen Sie mehr in den Nutzungsbedingungen.