M-Alpha-Fear and Greed - Crypto Sentiment Index
What it does
M-Alpha-Fear & Greed measures crypto market sentiment on a scale from 0 (extreme fear) to 100 (extreme greed), directly from chart data. It works on any coin and any timeframe, without external feeds. A table shows the overall value, its zone (Extreme fear, Fear, Neutral, Greed, Extreme greed) and the five parts it is built from, so you can see why the market reads the way it does.
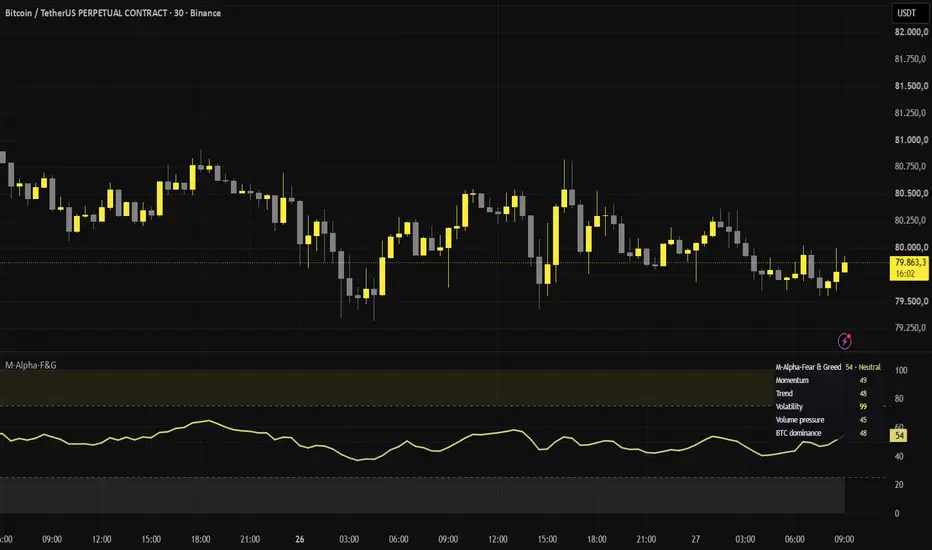
Example (as on the chart above): BTC perpetual, 30 minutes. Overall 54, Neutral. Momentum 49, trend 48, volatility 99 (a very calm market counts as greed), volume pressure 45, BTC dominance 48. The market is quiet, but buyers are not in control.
How it works
Each part is scaled from 0 to 100 against its own history on the current chart (default: the last 365 bars), so the index adapts to every coin and timeframe.
1. Momentum: RSI (14). High = greed.
2. Trend: distance of price from its 50-bar moving average, ranked against history. Far above = greed.
3. Volatility: realized volatility of log returns over 30 bars, ranked and inverted. Turbulent markets = fear, calm markets = greed.
4. Volume pressure: volume on up candles minus volume on down candles, as a share of total volume over 14 bars. Buyers dominating = greed.
5. BTC dominance: change of Bitcoin dominance over 14 bars, ranked and inverted. Money moving into Bitcoin = fear for the rest of the market.
The overall value is the weighted average of all parts (default weights 25 / 25 / 20 / 20 / 10), lightly smoothed. Parts without data, for example volume on some symbols, are left out automatically.
How to use it
- Add the script to any crypto chart. On the daily chart, 365 bars of history equal one year.
- Change weights or switch parts off (weight 0) in the settings.
- Adjust the zone limits (default 25 / 45 / 55 / 75) to your market.
- Four alert conditions are available: entering and leaving extreme fear, entering and leaving extreme greed.
What makes it different
- Built for crypto: includes volatility, volume pressure and BTC dominance, not just momentum and trend.
- Works on every coin and timeframe, not only as one daily number for Bitcoin.
- Shows every part separately, so the reading is transparent.
Limitations
- Sentiment describes the current mood of the market. It is not a buy or sell signal and makes no statement about future price movement.
- Values depend on the chosen history. A short history reacts faster but is less stable.
- BTC dominance comes from CRYPTOCAP:BTC.D; on charts where it is unavailable, this part is left out.
M-Alpha-Fear & Greed measures crypto market sentiment on a scale from 0 (extreme fear) to 100 (extreme greed), directly from chart data. It works on any coin and any timeframe, without external feeds. A table shows the overall value, its zone (Extreme fear, Fear, Neutral, Greed, Extreme greed) and the five parts it is built from, so you can see why the market reads the way it does.
Example (as on the chart above): BTC perpetual, 30 minutes. Overall 54, Neutral. Momentum 49, trend 48, volatility 99 (a very calm market counts as greed), volume pressure 45, BTC dominance 48. The market is quiet, but buyers are not in control.
How it works
Each part is scaled from 0 to 100 against its own history on the current chart (default: the last 365 bars), so the index adapts to every coin and timeframe.
1. Momentum: RSI (14). High = greed.
2. Trend: distance of price from its 50-bar moving average, ranked against history. Far above = greed.
3. Volatility: realized volatility of log returns over 30 bars, ranked and inverted. Turbulent markets = fear, calm markets = greed.
4. Volume pressure: volume on up candles minus volume on down candles, as a share of total volume over 14 bars. Buyers dominating = greed.
5. BTC dominance: change of Bitcoin dominance over 14 bars, ranked and inverted. Money moving into Bitcoin = fear for the rest of the market.
The overall value is the weighted average of all parts (default weights 25 / 25 / 20 / 20 / 10), lightly smoothed. Parts without data, for example volume on some symbols, are left out automatically.
How to use it
- Add the script to any crypto chart. On the daily chart, 365 bars of history equal one year.
- Change weights or switch parts off (weight 0) in the settings.
- Adjust the zone limits (default 25 / 45 / 55 / 75) to your market.
- Four alert conditions are available: entering and leaving extreme fear, entering and leaving extreme greed.
What makes it different
- Built for crypto: includes volatility, volume pressure and BTC dominance, not just momentum and trend.
- Works on every coin and timeframe, not only as one daily number for Bitcoin.
- Shows every part separately, so the reading is transparent.
Limitations
- Sentiment describes the current mood of the market. It is not a buy or sell signal and makes no statement about future price movement.
- Values depend on the chosen history. A short history reacts faster but is less stable.
- BTC dominance comes from CRYPTOCAP:BTC.D; on charts where it is unavailable, this part is left out.

Tested on unseen data, honest weekly results, no promises. malphacore.com · Shop: t.me/MAlphaCoreShopBot?start=tv
Haftungsausschluss
Die Informationen und Veröffentlichungen sind nicht als Finanz-, Anlage-, Handels- oder andere Arten von Ratschlägen oder Empfehlungen gedacht, die von TradingView bereitgestellt oder gebilligt werden, und stellen diese nicht dar. Lesen Sie mehr in den Nutzungsbedingungen.
Tested on unseen data, honest weekly results, no promises. malphacore.com · Shop: t.me/MAlphaCoreShopBot?start=tv
Haftungsausschluss
Die Informationen und Veröffentlichungen sind nicht als Finanz-, Anlage-, Handels- oder andere Arten von Ratschlägen oder Empfehlungen gedacht, die von TradingView bereitgestellt oder gebilligt werden, und stellen diese nicht dar. Lesen Sie mehr in den Nutzungsbedingungen.