Riverstone Ribbon
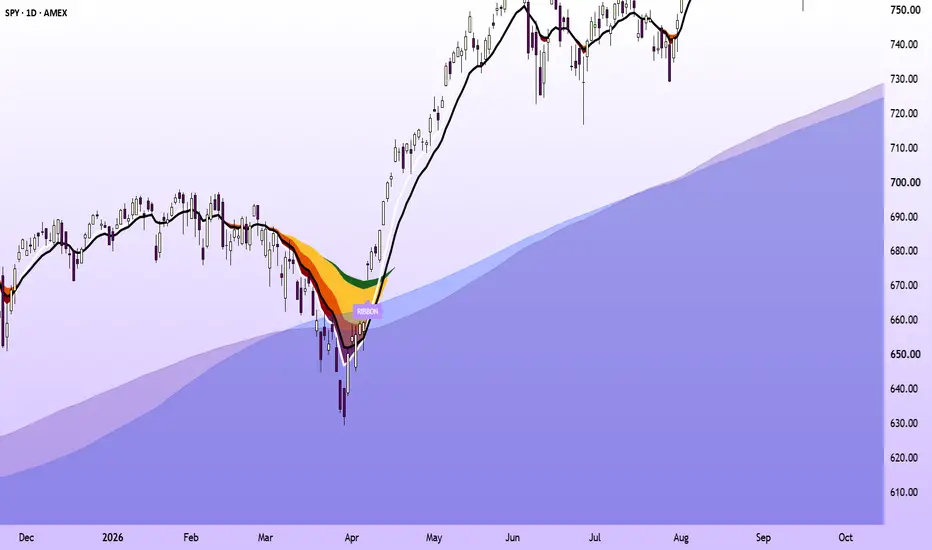
Riverstone Ribbon draws an eight-EMA ribbon (8, 12, 21, 50, 72, 100, 150, 200) and marks one specific event on it: the cascade cross, where a pullback turns much of the ribbon upside down and the 8 EMA then crosses back above the 12. The goal is to mark the end of a deep pullback inside a longer uptrend, rather than every short-term EMA cross. 200-period SMA and EMA areas, from both the chart's timeframe and the daily chart, show the long-term trend the signal is filtered against.
WHAT'S ORIGINAL
EMA ribbons and 8/12 EMA crosses are common. What this script adds is a condition on the cross: it only counts after the pullback has inverted a minimum number of the ribbon's seven neighboring EMA pairs (four by default) while the 8 EMA was below the 12. That turns a frequent, noisy cross into a rare one tied to a real pullback. Each cascade cross is then checked against a trend filter and labeled qualified or not qualified, and the hover text shows the numbers behind it. Shading only the inverted bands (the default) makes the depth of the cascade visible at a glance. The source is open so anyone can check that the script does what this description says.
WHY THE PIECES ARE COMBINED
- The ribbon and its shading show the cascade forming; the signal is defined by them.
- The chart's 200 SMA is the qualifying filter: a cross qualifies only when the close is above it. The 200 areas show at a glance which side of that filter price is on.
- The daily 200 SMA and EMA carry the same long-term context onto intraday charts, where the chart's own 200-bar averages cover only days or weeks.
HOW IT WORKS
1. Ribbon
Eight EMAs of the close. By default only the 8 and 12 lines are drawn; the other six are hidden but still drive the shading (tick them in the Style tab to draw them). Each band between neighboring EMAs is shaded while it is inverted (faster EMA below slower). Turn off "Shade Only Inversions" to shade upright bands too.
2. Cascade cross
While the 8 EMA is below the 12 EMA, the script counts how many of the seven neighboring pairs (8/12, 12/21, 21/50, 50/72, 72/100, 100/150, 150/200) are inverted. If that count reaches the threshold (default 4) at any point during the dip, the dip is armed. When the 8 EMA next crosses above the 12, a cascade cross is recorded. Every 8-over-12 cross ends the dip and resets the count, signal or not, so each dip produces at most one signal. A threshold of 4 tested best; 5 or 6 gave fewer signals and no better results.
3. Qualifying
By default a cascade cross is QUALIFIED (purple "RIBBON" label) when the close is above the 200 SMA of the chart's timeframe. An optional second rule requires the 50 SMA to be higher than it was 20 bars earlier. It is off by default because a deep cascade almost always turns the 50 SMA down; on SPY daily since 1994 it left only 2 signals. Crosses that don't qualify are drawn as small triangles (can be turned off), and their hover text says which rule failed.
4. 200 areas
- Daily 200 SMA (blue) and daily 200 EMA (purple), taken from the daily chart.
- Chart 200 SMA and EMA: red and orange on charts below daily; on weekly and higher charts they use the daily colors.
- On the daily chart the chart 200s are hidden, because they are the same lines as the daily 200s.
Each is drawn as an area at 30% opacity and can be turned off or recolored.
HOW TO USE IT
The signal was built and tested on daily charts. Historical test on SPY daily, 1994 to 2026, with the default settings:
- Entry at the close of each qualified cascade cross.
- Exit at the first of: a close more than 3 x ATR(14) below entry (that distance clamped to 2-6%); an intraday low 1.25 times that distance below entry; a close with RSI(14) at or above 75; or 60 bars held.
- No commissions or slippage; each trade counted at equal size.
Results: 26 trades, 69% winners, profit factor 3.1, average +3.2% per trade. The same rules on the S&P 500 index from 1983 to 2019: 68% winners, profit factor 2.8. On QQQ, IWM and XLK: 52% winners, profit factor 1.5. On the S&P 500 before 1983: 37% winners. With faster profit-taking (exiting at the first overbought peak instead of waiting for RSI 75), SPY still won 65% of the time but the average trade fell to +0.5%. Waiting for price to dip back to the 8 EMA after the cross tested worse than entering on the cross itself.
26 trades is a small sample, and results clearly vary by symbol and era. These are historical observations, not predictions. A qualified cross is a prompt to look more closely at the chart, not a signal to act on by itself.
NOTES AND LIMITATIONS
- Crosses are evaluated on each update of the current bar, so a label can appear and then disappear while the bar is still forming. Only labels on closed bars are final. For alerts on "Ribbon Cascade Cross (qualified)", choose "Once Per Bar Close".
- On intraday charts, the daily 200s step once per day on historical bars and update live during the current session.
- Designed for standard candle or bar charts; not intended for Heikin Ashi, Renko or other non-standard chart types.
- TradingView keeps the 500 most recent labels, so on very long histories the oldest signals drop off.
- An optional Pine Logs setting (off by default) writes each cascade cross and the close-to-close change 5, 10, 20 and 40 bars later, for anyone who wants to study the signal on their own symbols.
This script is for chart analysis and education. It is not financial advice and does not recommend buying or selling anything.
WHAT'S ORIGINAL
EMA ribbons and 8/12 EMA crosses are common. What this script adds is a condition on the cross: it only counts after the pullback has inverted a minimum number of the ribbon's seven neighboring EMA pairs (four by default) while the 8 EMA was below the 12. That turns a frequent, noisy cross into a rare one tied to a real pullback. Each cascade cross is then checked against a trend filter and labeled qualified or not qualified, and the hover text shows the numbers behind it. Shading only the inverted bands (the default) makes the depth of the cascade visible at a glance. The source is open so anyone can check that the script does what this description says.
WHY THE PIECES ARE COMBINED
- The ribbon and its shading show the cascade forming; the signal is defined by them.
- The chart's 200 SMA is the qualifying filter: a cross qualifies only when the close is above it. The 200 areas show at a glance which side of that filter price is on.
- The daily 200 SMA and EMA carry the same long-term context onto intraday charts, where the chart's own 200-bar averages cover only days or weeks.
HOW IT WORKS
1. Ribbon
Eight EMAs of the close. By default only the 8 and 12 lines are drawn; the other six are hidden but still drive the shading (tick them in the Style tab to draw them). Each band between neighboring EMAs is shaded while it is inverted (faster EMA below slower). Turn off "Shade Only Inversions" to shade upright bands too.
2. Cascade cross
While the 8 EMA is below the 12 EMA, the script counts how many of the seven neighboring pairs (8/12, 12/21, 21/50, 50/72, 72/100, 100/150, 150/200) are inverted. If that count reaches the threshold (default 4) at any point during the dip, the dip is armed. When the 8 EMA next crosses above the 12, a cascade cross is recorded. Every 8-over-12 cross ends the dip and resets the count, signal or not, so each dip produces at most one signal. A threshold of 4 tested best; 5 or 6 gave fewer signals and no better results.
3. Qualifying
By default a cascade cross is QUALIFIED (purple "RIBBON" label) when the close is above the 200 SMA of the chart's timeframe. An optional second rule requires the 50 SMA to be higher than it was 20 bars earlier. It is off by default because a deep cascade almost always turns the 50 SMA down; on SPY daily since 1994 it left only 2 signals. Crosses that don't qualify are drawn as small triangles (can be turned off), and their hover text says which rule failed.
4. 200 areas
- Daily 200 SMA (blue) and daily 200 EMA (purple), taken from the daily chart.
- Chart 200 SMA and EMA: red and orange on charts below daily; on weekly and higher charts they use the daily colors.
- On the daily chart the chart 200s are hidden, because they are the same lines as the daily 200s.
Each is drawn as an area at 30% opacity and can be turned off or recolored.
HOW TO USE IT
The signal was built and tested on daily charts. Historical test on SPY daily, 1994 to 2026, with the default settings:
- Entry at the close of each qualified cascade cross.
- Exit at the first of: a close more than 3 x ATR(14) below entry (that distance clamped to 2-6%); an intraday low 1.25 times that distance below entry; a close with RSI(14) at or above 75; or 60 bars held.
- No commissions or slippage; each trade counted at equal size.
Results: 26 trades, 69% winners, profit factor 3.1, average +3.2% per trade. The same rules on the S&P 500 index from 1983 to 2019: 68% winners, profit factor 2.8. On QQQ, IWM and XLK: 52% winners, profit factor 1.5. On the S&P 500 before 1983: 37% winners. With faster profit-taking (exiting at the first overbought peak instead of waiting for RSI 75), SPY still won 65% of the time but the average trade fell to +0.5%. Waiting for price to dip back to the 8 EMA after the cross tested worse than entering on the cross itself.
26 trades is a small sample, and results clearly vary by symbol and era. These are historical observations, not predictions. A qualified cross is a prompt to look more closely at the chart, not a signal to act on by itself.
NOTES AND LIMITATIONS
- Crosses are evaluated on each update of the current bar, so a label can appear and then disappear while the bar is still forming. Only labels on closed bars are final. For alerts on "Ribbon Cascade Cross (qualified)", choose "Once Per Bar Close".
- On intraday charts, the daily 200s step once per day on historical bars and update live during the current session.
- Designed for standard candle or bar charts; not intended for Heikin Ashi, Renko or other non-standard chart types.
- TradingView keeps the 500 most recent labels, so on very long histories the oldest signals drop off.
- An optional Pine Logs setting (off by default) writes each cascade cross and the close-to-close change 5, 10, 20 and 40 bars later, for anyone who wants to study the signal on their own symbols.
This script is for chart analysis and education. It is not financial advice and does not recommend buying or selling anything.

Haftungsausschluss
Die Informationen und Veröffentlichungen sind nicht als Finanz-, Anlage-, Handels- oder andere Arten von Ratschlägen oder Empfehlungen gedacht, die von TradingView bereitgestellt oder gebilligt werden, und stellen diese nicht dar. Lesen Sie mehr in den Nutzungsbedingungen.
Haftungsausschluss
Die Informationen und Veröffentlichungen sind nicht als Finanz-, Anlage-, Handels- oder andere Arten von Ratschlägen oder Empfehlungen gedacht, die von TradingView bereitgestellt oder gebilligt werden, und stellen diese nicht dar. Lesen Sie mehr in den Nutzungsbedingungen.