OPEN-SOURCE SCRIPT
EMA Momentum Differential
Overview
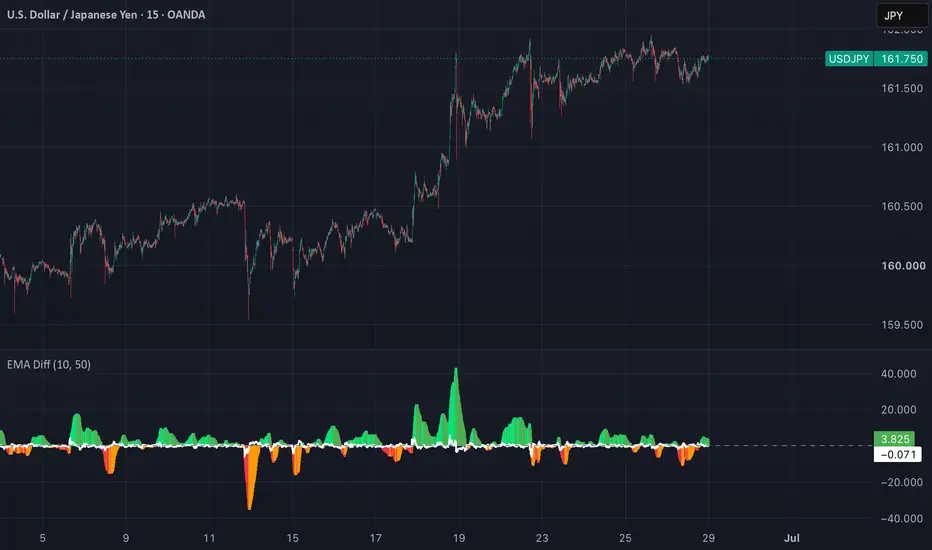
EMA Momentum Differential visualizes both the distance between two Exponential Moving Averages (EMAs) and the rate at which that distance changes over time.
While many moving average indicators focus on crossover events, this indicator continuously measures the relationship between a fast EMA and a slow EMA to provide additional context about trend momentum.
The EMA spread is displayed as a histogram, while its first-order change (Momentum Differential) is plotted as a line, helping identify periods when directional momentum is strengthening or weakening.
Values are automatically normalized into pip units for improved readability across both JPY and non-JPY Forex pairs.
How It Works
The indicator performs the following calculations:
- Calculates a Fast EMA.
- Calculates a Slow EMA.
- Measures the spread between both EMAs.
- Converts the spread into pip units.
- Calculates the change in spread from the previous bar (Momentum Differential).
- Displays the EMA spread as a histogram and the Momentum Differential as a line.
Interpretation
General observations may include:
- Positive spread values indicate the fast EMA is above the slow EMA.
- Negative spread values indicate the fast EMA is below the slow EMA.
- An increasing Momentum Differential suggests the EMA spread is expanding.
- A decreasing Momentum Differential suggests the EMA spread is contracting.
- Momentum Differential crossing the zero line may indicate a change in the rate of trend expansion.
This indicator is intended to provide additional context for momentum analysis and should not be interpreted as a standalone trading system.
Inputs
Fast EMA Length
Slow EMA Length
Notes
EMA Momentum Differential is designed as an analytical tool for evaluating changes in EMA separation.
It does not generate buy or sell signals and should be used together with broader market analysis and appropriate risk management.
Disclaimer
This indicator is provided for educational and analytical purposes only.
Nothing contained in this publication should be interpreted as financial or investment advice.
Past market behavior does not guarantee future results.
EMA Momentum Differential visualizes both the distance between two Exponential Moving Averages (EMAs) and the rate at which that distance changes over time.
While many moving average indicators focus on crossover events, this indicator continuously measures the relationship between a fast EMA and a slow EMA to provide additional context about trend momentum.
The EMA spread is displayed as a histogram, while its first-order change (Momentum Differential) is plotted as a line, helping identify periods when directional momentum is strengthening or weakening.
Values are automatically normalized into pip units for improved readability across both JPY and non-JPY Forex pairs.
How It Works
The indicator performs the following calculations:
- Calculates a Fast EMA.
- Calculates a Slow EMA.
- Measures the spread between both EMAs.
- Converts the spread into pip units.
- Calculates the change in spread from the previous bar (Momentum Differential).
- Displays the EMA spread as a histogram and the Momentum Differential as a line.
Interpretation
General observations may include:
- Positive spread values indicate the fast EMA is above the slow EMA.
- Negative spread values indicate the fast EMA is below the slow EMA.
- An increasing Momentum Differential suggests the EMA spread is expanding.
- A decreasing Momentum Differential suggests the EMA spread is contracting.
- Momentum Differential crossing the zero line may indicate a change in the rate of trend expansion.
This indicator is intended to provide additional context for momentum analysis and should not be interpreted as a standalone trading system.
Inputs
Fast EMA Length
Slow EMA Length
Notes
EMA Momentum Differential is designed as an analytical tool for evaluating changes in EMA separation.
It does not generate buy or sell signals and should be used together with broader market analysis and appropriate risk management.
Disclaimer
This indicator is provided for educational and analytical purposes only.
Nothing contained in this publication should be interpreted as financial or investment advice.
Past market behavior does not guarantee future results.
Open-source Skript
Ganz im Sinne von TradingView hat dieser Autor sein/ihr Script als Open-Source veröffentlicht. Auf diese Weise können nun auch andere Trader das Script rezensieren und die Funktionalität überprüfen. Vielen Dank an den Autor! Sie können das Script kostenlos verwenden, aber eine Wiederveröffentlichung des Codes unterliegt unseren Hausregeln.

Haftungsausschluss
Die Informationen und Veröffentlichungen sind nicht als Finanz-, Anlage-, Handels- oder andere Arten von Ratschlägen oder Empfehlungen gedacht, die von TradingView bereitgestellt oder gebilligt werden, und stellen diese nicht dar. Lesen Sie mehr in den Nutzungsbedingungen.
Open-source Skript
Ganz im Sinne von TradingView hat dieser Autor sein/ihr Script als Open-Source veröffentlicht. Auf diese Weise können nun auch andere Trader das Script rezensieren und die Funktionalität überprüfen. Vielen Dank an den Autor! Sie können das Script kostenlos verwenden, aber eine Wiederveröffentlichung des Codes unterliegt unseren Hausregeln.
Haftungsausschluss
Die Informationen und Veröffentlichungen sind nicht als Finanz-, Anlage-, Handels- oder andere Arten von Ratschlägen oder Empfehlungen gedacht, die von TradingView bereitgestellt oder gebilligt werden, und stellen diese nicht dar. Lesen Sie mehr in den Nutzungsbedingungen.