duongphuoc - Sonic R EMA & Price Action Channel
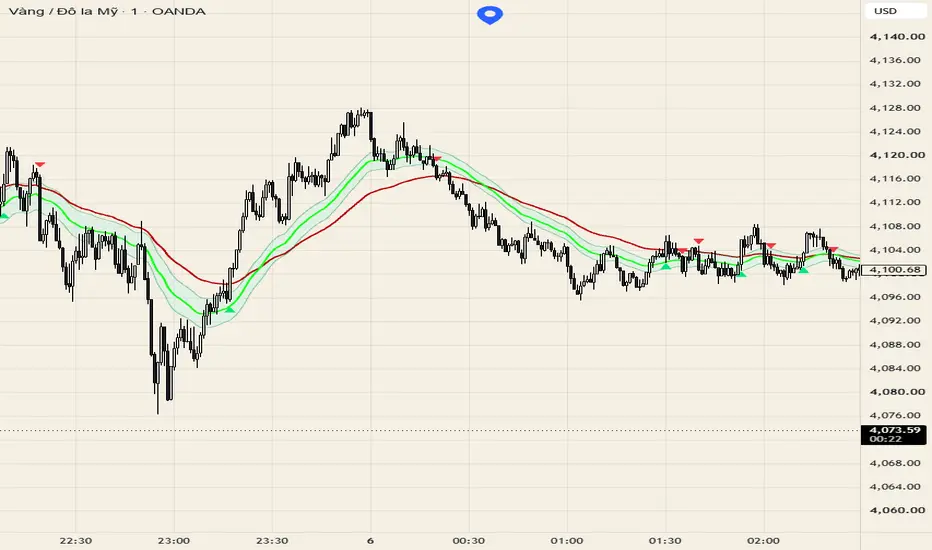
Sonic R EMA & Price Action Channel is a charting tool that combines a configurable Trend EMA with a three-line Price Action Channel and a Wave Cross detection feature.
The indicator is designed to make it easier to observe how price moves around the Price Action Channel and whether a movement develops far enough to cross both the channel and the Trend EMA.
HOW IT WORKS
The indicator contains three main components:
1. Trend EMA
The default Trend EMA period is 63.
This EMA is displayed separately from the Price Action Channel and provides an additional reference for the broader price movement.
The period and color can be customized in the indicator settings.
2. Price Action Channel
The Price Action Channel uses three exponential moving averages calculated from:
- High
- Close
- Low
The default period is 32.
The High and Low EMAs form the upper and lower boundaries of the channel, while the Close EMA runs through the center.
The area between the High and Low boundaries is filled to make the channel easier to identify visually.
3. Wave Cross
Wave Cross tracks price movement from one side of the Price Action Channel to the other.
A bullish Wave Cross begins after price closes below the lower boundary of the Price Action Channel.
The bullish movement is considered complete only when price later closes:
- Above the upper boundary of the Price Action Channel.
- Above the Trend EMA.
A bearish Wave Cross works in the opposite direction.
It begins after price closes above the upper boundary of the Price Action Channel and is completed only when price later closes:
- Below the lower boundary of the Price Action Channel.
- Below the Trend EMA.
When a Wave Cross is completed, the indicator displays a small marker on the chart.
The marker distance from the candle can be adjusted in the settings.
WAVE CROSS IS NOT A BUY OR SELL SIGNAL
Wave Cross is intended to identify a specific price movement, not to automatically generate trading entries.
A bullish marker simply means that price moved from below the Price Action Channel to the opposite side and also closed above the Trend EMA.
A bearish marker represents the opposite movement.
The user should evaluate market structure, price location, momentum, support and resistance, supply and demand, or other relevant context before making a trading decision.
SETTINGS
Trend EMA Period
Defines the period used for the Trend EMA.
Default: 63.
Show Trend EMA
Shows or hides the Trend EMA.
Trend EMA Color
Changes the color of the Trend EMA.
Price Action Channel Period
Defines the EMA period used for the High, Close and Low components of the Price Action Channel.
Default: 32.
Show Price Action Channel
Shows or hides the complete Price Action Channel.
Close EMA Color
Changes the color of the center Close EMA.
High / Low EMA Color
Changes the color of the upper and lower Price Action Channel boundaries.
Fill Color
Changes the channel background color.
Show Wave Cross
Shows or hides Wave Cross markers.
Marker Distance
Controls how far the Wave Cross markers are displayed from the corresponding candle. The distance is scaled using ATR so that marker spacing adapts to market volatility.
Bullish / Bearish Marker Color
Changes the marker colors.
Show EMA Labels
Shows or hides the labels identifying the Trend EMA and Price Action Channel on the latest bar.
WHY THIS SCRIPT IS DIFFERENT
The script is not intended simply to display two moving-average structures together.
Its additional Wave Cross logic follows a movement from one side of the Price Action Channel to the other and requires price to also close beyond the Trend EMA before the movement is considered complete.
This provides a consistent visual definition for identifying full channel-crossing price movements instead of relying only on individual EMA crossovers.
LIMITATIONS
Wave Cross does not determine whether the market is trending or ranging.
Because the current version does not include a sideways-market filter, Wave Cross events can also occur during consolidation when price repeatedly moves through the Price Action Channel and Trend EMA.
For this reason, Wave Cross markers should not be interpreted as standalone trading signals.
Moving averages are lagging calculations and respond to price after movement has already occurred.
The behavior of the indicator can also vary significantly depending on the symbol, timeframe, volatility and selected EMA periods.
---
TIENG VIET
Sonic R EMA & Price Action Channel là chỉ báo kết hợp EMA xu hướng, Price Action Channel và chức năng nhận diện Wave Cross.
Mục tiêu của chỉ báo là giúp quan sát rõ hơn cách giá di chuyển quanh Price Action Channel và nhận diện những nhịp giá đi hoàn toàn từ một phía của kênh sang phía đối diện, đồng thời vượt qua EMA xu hướng.
CAC THANH PHAN CHINH
1. Trend EMA
EMA xu hướng mặc định có chu kỳ 63.
Đây là đường EMA độc lập với Price Action Channel và được sử dụng như một mốc tham chiếu bổ sung cho chuyển động giá.
Người dùng có thể thay đổi chu kỳ, màu sắc hoặc tắt hoàn toàn đường EMA này.
2. Price Action Channel
Price Action Channel gồm ba đường EMA được tính từ:
- High
- Close
- Low
Chu kỳ mặc định là 32.
EMA High và EMA Low tạo thành hai biên của kênh, trong khi EMA Close nằm ở giữa.
Vùng giữa EMA High và EMA Low được tô màu để dễ quan sát.
3. Wave Cross
Wave Cross theo dõi một nhịp giá đi từ một phía của Price Action Channel sang phía đối diện.
Với Wave Cross tăng:
Quá trình bắt đầu khi giá đóng cửa phía dưới biên Low của Price Action Channel.
Wave Cross chỉ được xác nhận khi sau đó giá:
- Đóng cửa phía trên biên High của Price Action Channel.
- Đồng thời đóng cửa phía trên Trend EMA.
Wave Cross giảm hoạt động theo chiều ngược lại.
Quá trình bắt đầu khi giá đóng cửa phía trên biên High của Price Action Channel.
Wave Cross được xác nhận khi giá:
- Đóng cửa phía dưới biên Low của Price Action Channel.
- Đồng thời đóng cửa phía dưới Trend EMA.
Khi một Wave Cross hoàn thành, chỉ báo sẽ đánh dấu một ký hiệu nhỏ trên biểu đồ.
Khoảng cách của ký hiệu so với nến có thể được tùy chỉnh.
WAVE CROSS KHONG PHAI TIN HIEU BUY / SELL
Wave Cross chỉ mô tả một dạng chuyển động giá.
Dấu tăng không có nghĩa giá chắc chắn tiếp tục tăng và dấu giảm cũng không có nghĩa giá chắc chắn tiếp tục giảm.
Người dùng nên kết hợp vị trí giá, cấu trúc thị trường, momentum, hỗ trợ/kháng cự, Supply & Demand hoặc phương pháp phân tích riêng trước khi đưa ra quyết định giao dịch.
LUU Y
Phiên bản hiện tại chưa có bộ lọc thị trường sideway.
Do đó, trong vùng tích lũy hoặc khi giá liên tục dao động quanh Price Action Channel và Trend EMA, chỉ báo vẫn có thể tạo Wave Cross.
Đây là giới hạn đã biết của phiên bản hiện tại và là lý do Wave Cross không nên được sử dụng như một tín hiệu giao dịch độc lập.
EMA cũng là chỉ báo có độ trễ và phản ứng sau biến động giá.
Kết quả quan sát có thể thay đổi tùy thị trường, timeframe, mức biến động và các chu kỳ EMA được lựa chọn.
The indicator is designed to make it easier to observe how price moves around the Price Action Channel and whether a movement develops far enough to cross both the channel and the Trend EMA.
HOW IT WORKS
The indicator contains three main components:
1. Trend EMA
The default Trend EMA period is 63.
This EMA is displayed separately from the Price Action Channel and provides an additional reference for the broader price movement.
The period and color can be customized in the indicator settings.
2. Price Action Channel
The Price Action Channel uses three exponential moving averages calculated from:
- High
- Close
- Low
The default period is 32.
The High and Low EMAs form the upper and lower boundaries of the channel, while the Close EMA runs through the center.
The area between the High and Low boundaries is filled to make the channel easier to identify visually.
3. Wave Cross
Wave Cross tracks price movement from one side of the Price Action Channel to the other.
A bullish Wave Cross begins after price closes below the lower boundary of the Price Action Channel.
The bullish movement is considered complete only when price later closes:
- Above the upper boundary of the Price Action Channel.
- Above the Trend EMA.
A bearish Wave Cross works in the opposite direction.
It begins after price closes above the upper boundary of the Price Action Channel and is completed only when price later closes:
- Below the lower boundary of the Price Action Channel.
- Below the Trend EMA.
When a Wave Cross is completed, the indicator displays a small marker on the chart.
The marker distance from the candle can be adjusted in the settings.
WAVE CROSS IS NOT A BUY OR SELL SIGNAL
Wave Cross is intended to identify a specific price movement, not to automatically generate trading entries.
A bullish marker simply means that price moved from below the Price Action Channel to the opposite side and also closed above the Trend EMA.
A bearish marker represents the opposite movement.
The user should evaluate market structure, price location, momentum, support and resistance, supply and demand, or other relevant context before making a trading decision.
SETTINGS
Trend EMA Period
Defines the period used for the Trend EMA.
Default: 63.
Show Trend EMA
Shows or hides the Trend EMA.
Trend EMA Color
Changes the color of the Trend EMA.
Price Action Channel Period
Defines the EMA period used for the High, Close and Low components of the Price Action Channel.
Default: 32.
Show Price Action Channel
Shows or hides the complete Price Action Channel.
Close EMA Color
Changes the color of the center Close EMA.
High / Low EMA Color
Changes the color of the upper and lower Price Action Channel boundaries.
Fill Color
Changes the channel background color.
Show Wave Cross
Shows or hides Wave Cross markers.
Marker Distance
Controls how far the Wave Cross markers are displayed from the corresponding candle. The distance is scaled using ATR so that marker spacing adapts to market volatility.
Bullish / Bearish Marker Color
Changes the marker colors.
Show EMA Labels
Shows or hides the labels identifying the Trend EMA and Price Action Channel on the latest bar.
WHY THIS SCRIPT IS DIFFERENT
The script is not intended simply to display two moving-average structures together.
Its additional Wave Cross logic follows a movement from one side of the Price Action Channel to the other and requires price to also close beyond the Trend EMA before the movement is considered complete.
This provides a consistent visual definition for identifying full channel-crossing price movements instead of relying only on individual EMA crossovers.
LIMITATIONS
Wave Cross does not determine whether the market is trending or ranging.
Because the current version does not include a sideways-market filter, Wave Cross events can also occur during consolidation when price repeatedly moves through the Price Action Channel and Trend EMA.
For this reason, Wave Cross markers should not be interpreted as standalone trading signals.
Moving averages are lagging calculations and respond to price after movement has already occurred.
The behavior of the indicator can also vary significantly depending on the symbol, timeframe, volatility and selected EMA periods.
---
TIENG VIET
Sonic R EMA & Price Action Channel là chỉ báo kết hợp EMA xu hướng, Price Action Channel và chức năng nhận diện Wave Cross.
Mục tiêu của chỉ báo là giúp quan sát rõ hơn cách giá di chuyển quanh Price Action Channel và nhận diện những nhịp giá đi hoàn toàn từ một phía của kênh sang phía đối diện, đồng thời vượt qua EMA xu hướng.
CAC THANH PHAN CHINH
1. Trend EMA
EMA xu hướng mặc định có chu kỳ 63.
Đây là đường EMA độc lập với Price Action Channel và được sử dụng như một mốc tham chiếu bổ sung cho chuyển động giá.
Người dùng có thể thay đổi chu kỳ, màu sắc hoặc tắt hoàn toàn đường EMA này.
2. Price Action Channel
Price Action Channel gồm ba đường EMA được tính từ:
- High
- Close
- Low
Chu kỳ mặc định là 32.
EMA High và EMA Low tạo thành hai biên của kênh, trong khi EMA Close nằm ở giữa.
Vùng giữa EMA High và EMA Low được tô màu để dễ quan sát.
3. Wave Cross
Wave Cross theo dõi một nhịp giá đi từ một phía của Price Action Channel sang phía đối diện.
Với Wave Cross tăng:
Quá trình bắt đầu khi giá đóng cửa phía dưới biên Low của Price Action Channel.
Wave Cross chỉ được xác nhận khi sau đó giá:
- Đóng cửa phía trên biên High của Price Action Channel.
- Đồng thời đóng cửa phía trên Trend EMA.
Wave Cross giảm hoạt động theo chiều ngược lại.
Quá trình bắt đầu khi giá đóng cửa phía trên biên High của Price Action Channel.
Wave Cross được xác nhận khi giá:
- Đóng cửa phía dưới biên Low của Price Action Channel.
- Đồng thời đóng cửa phía dưới Trend EMA.
Khi một Wave Cross hoàn thành, chỉ báo sẽ đánh dấu một ký hiệu nhỏ trên biểu đồ.
Khoảng cách của ký hiệu so với nến có thể được tùy chỉnh.
WAVE CROSS KHONG PHAI TIN HIEU BUY / SELL
Wave Cross chỉ mô tả một dạng chuyển động giá.
Dấu tăng không có nghĩa giá chắc chắn tiếp tục tăng và dấu giảm cũng không có nghĩa giá chắc chắn tiếp tục giảm.
Người dùng nên kết hợp vị trí giá, cấu trúc thị trường, momentum, hỗ trợ/kháng cự, Supply & Demand hoặc phương pháp phân tích riêng trước khi đưa ra quyết định giao dịch.
LUU Y
Phiên bản hiện tại chưa có bộ lọc thị trường sideway.
Do đó, trong vùng tích lũy hoặc khi giá liên tục dao động quanh Price Action Channel và Trend EMA, chỉ báo vẫn có thể tạo Wave Cross.
Đây là giới hạn đã biết của phiên bản hiện tại và là lý do Wave Cross không nên được sử dụng như một tín hiệu giao dịch độc lập.
EMA cũng là chỉ báo có độ trễ và phản ứng sau biến động giá.
Kết quả quan sát có thể thay đổi tùy thị trường, timeframe, mức biến động và các chu kỳ EMA được lựa chọn.

Haftungsausschluss
Die Informationen und Veröffentlichungen sind nicht als Finanz-, Anlage-, Handels- oder andere Arten von Ratschlägen oder Empfehlungen gedacht, die von TradingView bereitgestellt oder gebilligt werden, und stellen diese nicht dar. Lesen Sie mehr in den Nutzungsbedingungen.
Haftungsausschluss
Die Informationen und Veröffentlichungen sind nicht als Finanz-, Anlage-, Handels- oder andere Arten von Ratschlägen oder Empfehlungen gedacht, die von TradingView bereitgestellt oder gebilligt werden, und stellen diese nicht dar. Lesen Sie mehr in den Nutzungsbedingungen.