OPEN-SOURCE SCRIPT
Aftershocks Fault
Every aftershock starts as a coil.
Fault is where the coin held still.
Three words to know.
Coil is how quiet a coin has been.
Its range, measured against its own last five days.
100% is as still as it gets.
Break is the first hour the price closes outside that quiet range.
Weather is everything around the coin while you wait.
This script is the Fault.
It paints the quiet onto the candles, then adds it up by price.
The code is open. Anyone can read how the Coil is measured.
It measures. It does not predict.
WHAT YOU SEE
Every candle takes a colour from its Coil.
Hot violet when the coin is loud. Cool teal when it is still.
Quiet stretches glow.
Candles keeping their usual colours? Hover the Fault name, open its menu, Visual order, Bring to front.
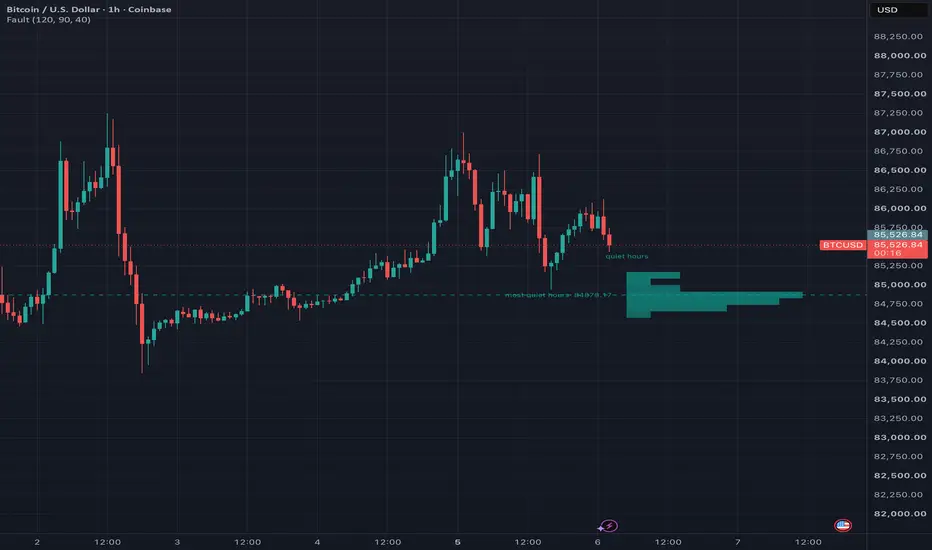
Bars on the right edge, under the title "quiet hours".
Each bar is a price row.
Its length is how many hours the coin closed at that price while it was quiet.
Bright bars are this day's stillness. Faint ones are last week's.
One dashed line, labelled "most quiet hours" with its price.
The row where this coin held still the longest.
A count of past hours. Not a level to trade.
HOW TO READ IT
Set the chart to 1h. Put Fault on it. Drag the chart left a little so the bars have room.
Look at the candles first.
A run of teal is a coil building.
Violet is the coin moving.
Then look at the bars.
One wide bar: the coin spent its calm hours at one price.
Several small bars: the calm was spread out.
Bright bars: the quiet is recent. Faint bars: it is old.
Then open Coil and Break on the same chart.
Coil shows the number. Break shows where the quiet ended.
Fault shows where it lived.
THE FULL SET
Fault is the open one. Its code is published.
Coil, Break and Weather are the protected set, each its own script.
Fault needs none of them. The chart above shows Fault alone.
HOW IT WORKS
Hourly candles. 20 closes. 2 standard deviations. Ranked against the last 120 hours.
The Coil function is the Coil script's, copied unchanged.
One request for hourly data, read one candle behind. Nothing repaints.
The tint runs violet at 0%, slate at 50%, teal at 100%.
The bars count the last 120 hourly closes with a Coil of 90% or more, split into 40 price rows.
A bar fades by the age of its newest quiet hour.
The line sits in the fullest row. On a tie, the lower row.
Settings: the three tint colours, hours counted (120), quiet threshold (90%), rows (40), bar width.
The Coil itself has no settings. It cannot drift from the method.
GOOD TO KNOW
Runs on 1-hour charts and below. Above 1 hour it halts and tells you so.
The Coil needs 139 hourly candles. Before that, no tint and no count.
The chart's own exchange feeds it, so another exchange gives different hours.
No alerts. No markers. No words on the candles.
The bars count hours, not volume.
Not a prediction. Not a trade signal. It counts where the quiet was.
Fault is where the coin held still.
Three words to know.
Coil is how quiet a coin has been.
Its range, measured against its own last five days.
100% is as still as it gets.
Break is the first hour the price closes outside that quiet range.
Weather is everything around the coin while you wait.
This script is the Fault.
It paints the quiet onto the candles, then adds it up by price.
The code is open. Anyone can read how the Coil is measured.
It measures. It does not predict.
WHAT YOU SEE
Every candle takes a colour from its Coil.
Hot violet when the coin is loud. Cool teal when it is still.
Quiet stretches glow.
Candles keeping their usual colours? Hover the Fault name, open its menu, Visual order, Bring to front.
Bars on the right edge, under the title "quiet hours".
Each bar is a price row.
Its length is how many hours the coin closed at that price while it was quiet.
Bright bars are this day's stillness. Faint ones are last week's.
One dashed line, labelled "most quiet hours" with its price.
The row where this coin held still the longest.
A count of past hours. Not a level to trade.
HOW TO READ IT
Set the chart to 1h. Put Fault on it. Drag the chart left a little so the bars have room.
Look at the candles first.
A run of teal is a coil building.
Violet is the coin moving.
Then look at the bars.
One wide bar: the coin spent its calm hours at one price.
Several small bars: the calm was spread out.
Bright bars: the quiet is recent. Faint bars: it is old.
Then open Coil and Break on the same chart.
Coil shows the number. Break shows where the quiet ended.
Fault shows where it lived.
THE FULL SET
Fault is the open one. Its code is published.
Coil, Break and Weather are the protected set, each its own script.
Fault needs none of them. The chart above shows Fault alone.
HOW IT WORKS
Hourly candles. 20 closes. 2 standard deviations. Ranked against the last 120 hours.
The Coil function is the Coil script's, copied unchanged.
One request for hourly data, read one candle behind. Nothing repaints.
The tint runs violet at 0%, slate at 50%, teal at 100%.
The bars count the last 120 hourly closes with a Coil of 90% or more, split into 40 price rows.
A bar fades by the age of its newest quiet hour.
The line sits in the fullest row. On a tie, the lower row.
Settings: the three tint colours, hours counted (120), quiet threshold (90%), rows (40), bar width.
The Coil itself has no settings. It cannot drift from the method.
GOOD TO KNOW
Runs on 1-hour charts and below. Above 1 hour it halts and tells you so.
The Coil needs 139 hourly candles. Before that, no tint and no count.
The chart's own exchange feeds it, so another exchange gives different hours.
No alerts. No markers. No words on the candles.
The bars count hours, not volume.
Not a prediction. Not a trade signal. It counts where the quiet was.
Open-source Skript
Ganz im Sinne von TradingView hat dieser Autor sein/ihr Script als Open-Source veröffentlicht. Auf diese Weise können nun auch andere Trader das Script rezensieren und die Funktionalität überprüfen. Vielen Dank an den Autor! Sie können das Script kostenlos verwenden, aber eine Wiederveröffentlichung des Codes unterliegt unseren Hausregeln.

Haftungsausschluss
Die Informationen und Veröffentlichungen sind nicht als Finanz-, Anlage-, Handels- oder andere Arten von Ratschlägen oder Empfehlungen gedacht, die von TradingView bereitgestellt oder gebilligt werden, und stellen diese nicht dar. Lesen Sie mehr in den Nutzungsbedingungen.
Open-source Skript
Ganz im Sinne von TradingView hat dieser Autor sein/ihr Script als Open-Source veröffentlicht. Auf diese Weise können nun auch andere Trader das Script rezensieren und die Funktionalität überprüfen. Vielen Dank an den Autor! Sie können das Script kostenlos verwenden, aber eine Wiederveröffentlichung des Codes unterliegt unseren Hausregeln.
Haftungsausschluss
Die Informationen und Veröffentlichungen sind nicht als Finanz-, Anlage-, Handels- oder andere Arten von Ratschlägen oder Empfehlungen gedacht, die von TradingView bereitgestellt oder gebilligt werden, und stellen diese nicht dar. Lesen Sie mehr in den Nutzungsbedingungen.