OPEN-SOURCE SCRIPT
Aktualisiert Regression-Slope Divergence with Reliability Scoring
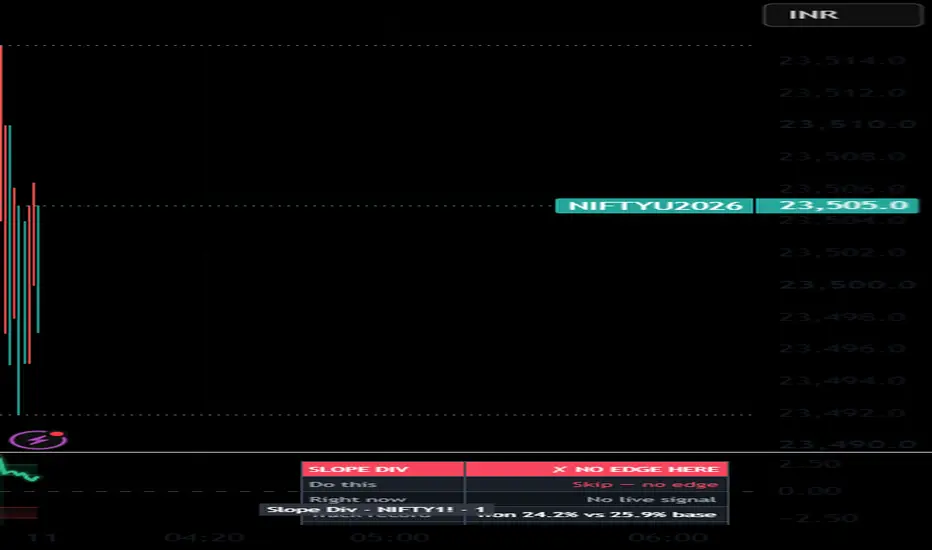
Regression-Slope Divergence with Reliability Scoring
Most divergence tools tell you a divergence exists. This one tells you whether that divergence has historically mattered on the symbol and timeframe you're actually looking at — and states the conclusion in plain words on the chart.
What it plots
A normalised momentum oscillator with stretch bands and divergence markers, plus a verdict panel that scores those divergences in real time. By default the chart stays minimal — just the oscillator and the verdict panel — with an optional key-info table and a per-direction track-record grid you can switch on in settings.
Why these components are combined, and how they work together
Three classical pieces are fused into a single pipeline — not stacked as independent signals:
Linear-regression slope of price — the direction price is genuinely trending.
RSI-based momentum, z-score normalised — the direction momentum is trending.
A binomial-proportion confidence test — whether the disagreement between the two has preceded a favourable move often enough to beat a same-zone baseline.
Components 1 and 2 only become a signal where they disagree — that disagreement is the divergence. Component 3 is the layer that makes this original: it records every past divergence on the current instrument, measures how often the expected move actually followed within a fixed look-ahead, compares that to what a random entry from the same stretched zone would have achieved, and wraps a confidence interval around the result. The parts are interdependent — remove any one and the script can no longer answer its core question, "is this divergence worth trading here?"
How to read it
The verdict panel translates the statistics into four states:
GREEN — edge confirmed: these divergences have beaten a same-spot baseline here. Worth acting on.
RED — no edge here: they've lost to a coin-flip from the same spot. Skip them, or try a higher timeframe (counter-trend divergence often fails on fast timeframes).
AMBER — unproven: edge not statistically established yet; treat as low-confidence.
GREY — learning: still collecting completed samples.
It also shows whether a signal is live right now and a reward-vs-risk figure — the average best move vs the average worst move after a signal, in ATR. Below 1:1 means signals have hurt more than they've helped. The optional grid breaks the record down into Bullish / Bearish with hit-rate, baseline, edge and reward:risk.
A divergence itself is simply price making a higher high / lower low while the momentum line does the opposite.
What's original
Off-the-shelf divergence indicators fire and leave you to guess. This one keeps a self-updating, confidence-scored track record against a same-zone baseline and tells you, in words, whether the current setup has earned your attention on this specific market.
Universal across markets
It reads only the chart's own price (the source is configurable in settings), so it runs on any symbol, any timeframe, in any market with no external data. Defaults are tuned for NIFTY futures; change the source and lengths for other instruments.
Outputs for other scripts
Generic EXP_* values — oscillator, signal, probability, edge, edge lower-bound, sample count, regime, trend strength and verdict tier — are published to the Data Window so other indicators can read them via input.source().
Concept credits
Relative-strength momentum and average true range — J. W. Wilder. Binomial score confidence interval — E. B. Wilson. Trend-efficiency regime measure — P. Kaufman. Least-squares regression — classical statistics.
Disclaimer
For research and education only. This is not financial advice, not a recommendation to buy or sell, and not a guarantee of future results. All performance shown is in-sample and past-only. Markets carry risk — do your own research and manage your own risk.
Most divergence tools tell you a divergence exists. This one tells you whether that divergence has historically mattered on the symbol and timeframe you're actually looking at — and states the conclusion in plain words on the chart.
What it plots
A normalised momentum oscillator with stretch bands and divergence markers, plus a verdict panel that scores those divergences in real time. By default the chart stays minimal — just the oscillator and the verdict panel — with an optional key-info table and a per-direction track-record grid you can switch on in settings.
Why these components are combined, and how they work together
Three classical pieces are fused into a single pipeline — not stacked as independent signals:
Linear-regression slope of price — the direction price is genuinely trending.
RSI-based momentum, z-score normalised — the direction momentum is trending.
A binomial-proportion confidence test — whether the disagreement between the two has preceded a favourable move often enough to beat a same-zone baseline.
Components 1 and 2 only become a signal where they disagree — that disagreement is the divergence. Component 3 is the layer that makes this original: it records every past divergence on the current instrument, measures how often the expected move actually followed within a fixed look-ahead, compares that to what a random entry from the same stretched zone would have achieved, and wraps a confidence interval around the result. The parts are interdependent — remove any one and the script can no longer answer its core question, "is this divergence worth trading here?"
How to read it
The verdict panel translates the statistics into four states:
GREEN — edge confirmed: these divergences have beaten a same-spot baseline here. Worth acting on.
RED — no edge here: they've lost to a coin-flip from the same spot. Skip them, or try a higher timeframe (counter-trend divergence often fails on fast timeframes).
AMBER — unproven: edge not statistically established yet; treat as low-confidence.
GREY — learning: still collecting completed samples.
It also shows whether a signal is live right now and a reward-vs-risk figure — the average best move vs the average worst move after a signal, in ATR. Below 1:1 means signals have hurt more than they've helped. The optional grid breaks the record down into Bullish / Bearish with hit-rate, baseline, edge and reward:risk.
A divergence itself is simply price making a higher high / lower low while the momentum line does the opposite.
What's original
Off-the-shelf divergence indicators fire and leave you to guess. This one keeps a self-updating, confidence-scored track record against a same-zone baseline and tells you, in words, whether the current setup has earned your attention on this specific market.
Universal across markets
It reads only the chart's own price (the source is configurable in settings), so it runs on any symbol, any timeframe, in any market with no external data. Defaults are tuned for NIFTY futures; change the source and lengths for other instruments.
Outputs for other scripts
Generic EXP_* values — oscillator, signal, probability, edge, edge lower-bound, sample count, regime, trend strength and verdict tier — are published to the Data Window so other indicators can read them via input.source().
Concept credits
Relative-strength momentum and average true range — J. W. Wilder. Binomial score confidence interval — E. B. Wilson. Trend-efficiency regime measure — P. Kaufman. Least-squares regression — classical statistics.
Disclaimer
For research and education only. This is not financial advice, not a recommendation to buy or sell, and not a guarantee of future results. All performance shown is in-sample and past-only. Markets carry risk — do your own research and manage your own risk.
Versionshinweise
v2.1 — An upgraded reliability harness plus robust normalization and a lag-minimal smoother. The dual linear-regression slope engine, the R²-gated momentum disagreement and the signal cool-down are unchanged — set Z-score mode = "Classic (mean/stdev)" and Output smoother = "EMA" for the original normalization.1. HARNESS+ reliability scoring. The track record now reports a uniqueness-weighted effective sample size (overlapping forward windows aren't independent), an in-sample / out-of-sample split (the OOS edge is the one to trust — exported as EXP_EdgeOOS), and a multiple-testing deflated significance bar across the bull/bear classes. A REGIME★ option can also restrict scoring to a chosen regime, and signals now mirror onto the price chart as tiny triangles; the verdict panel gains a Compact/Pro switch.
2. Robust MAD normalization + UltimateSmoother (default on). Momentum z-scored with a median/MAD statistic instead of mean/stdev so outlier bars don't distort the σ bands, and smoothed with Ehlers' lag-minimal UltimateSmoother. Reversible via "Z-score mode" / "Output smoother".
3. 3-window extreme consensus (opt-in, default off). z as the MEDIAN of the z at half, one and double the window — extreme only when short/medium/long agree.
What is unchanged. The fast + slow linear-regression slope of price and of momentum, the "require fast + slow to agree" gate, the R² trend-strength floor, the cool-down and the RSI-momentum oscillator are the published logic. Only the scoring harness is upgraded and the normalization made robust; the divergence signals themselves fire exactly as before.
Still context, not a standalone trigger. Non-repaint: the harness logs and resolves on confirmed bars. Concept credits unchanged (Wilder RSI/ATR; Wilson; Kaufman; least-squares regression; López de Prado uniqueness/OOS/deflation; Ehlers UltimateSmoother).
Versionshinweise
v2.2 — R1 honest-stats standardization. The reliability scoring is now backed by the published calibration libraries instead of local copies: robust-z via ml_robuststats/2, and the Wilson confidence half-width + hit-rate via ml_calib/2. Every one of those is byte-identical to the formula the script already used, so the oscillator, the divergence signals and the entire HARNESS+ track record (uniqueness weighting, in-sample/out-of-sample split, deflated significance) are unchanged. A new optional time-of-day significance gate (group 04, default OFF) can restrict divergences to statistically live intraday slots via ml_session/2. Imports are pinned to the exact published v2 versions. Same calibration engine now shared across the whole divergence family — numbers are directly comparable script to script.Open-source Skript
Ganz im Sinne von TradingView hat dieser Autor sein/ihr Script als Open-Source veröffentlicht. Auf diese Weise können nun auch andere Trader das Script rezensieren und die Funktionalität überprüfen. Vielen Dank an den Autor! Sie können das Script kostenlos verwenden, aber eine Wiederveröffentlichung des Codes unterliegt unseren Hausregeln.

Haftungsausschluss
Die Informationen und Veröffentlichungen sind nicht als Finanz-, Anlage-, Handels- oder andere Arten von Ratschlägen oder Empfehlungen gedacht, die von TradingView bereitgestellt oder gebilligt werden, und stellen diese nicht dar. Lesen Sie mehr in den Nutzungsbedingungen.
Open-source Skript
Ganz im Sinne von TradingView hat dieser Autor sein/ihr Script als Open-Source veröffentlicht. Auf diese Weise können nun auch andere Trader das Script rezensieren und die Funktionalität überprüfen. Vielen Dank an den Autor! Sie können das Script kostenlos verwenden, aber eine Wiederveröffentlichung des Codes unterliegt unseren Hausregeln.
Haftungsausschluss
Die Informationen und Veröffentlichungen sind nicht als Finanz-, Anlage-, Handels- oder andere Arten von Ratschlägen oder Empfehlungen gedacht, die von TradingView bereitgestellt oder gebilligt werden, und stellen diese nicht dar. Lesen Sie mehr in den Nutzungsbedingungen.