Sector Rotation & Market Breadth by Stocks above MA [AnyMinute]
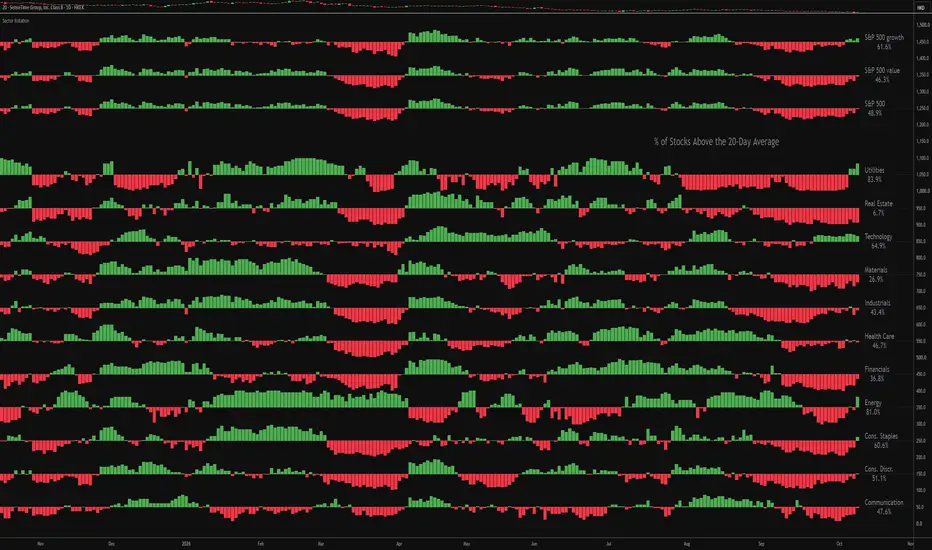
This sector rotation indicator displays participation across the eleven S&P 500 sectors, alongside the S&P 500, Value and Growth groups. Compare the percentage of stocks above a selected moving average to spot broadening strength, weakness and changes in sector leadership — all in one chart panel.
CHART SETUP
Use this indicator on a 1-day chart. All eleven sectors and three index groups appear together in one separate pane.
For the clearest view, stretch the indicator pane vertically to use as much chart height as possible, or maximize the pane. The layout works best when the breadth panel occupies most of the chart area.
HOW IT WORKS
The indicator retrieves participation readings from TradingView’s INDEX symbols, which provide the percentage of stocks trading above the corresponding daily moving average. The script brings those readings together in one panel.
Each sector or index group occupies a separate horizontal row. Its bars show the percentage of constituent stocks that trade above the selected daily moving average, measured against a 50% center line.
With the default colors:
At exactly 50%, the bar has no height.
The colors and bar heights represent participation — follow the changing bar heights to see whether participation is expanding or contracting. Changes in participation can support an assessment of rotation, particularly when considered alongside price trends and relative strength.
The eleven sector rows help reveal where strength and weakness are concentrated. The S&P 500, Value and Growth rows provide broader context for those differences.
The 10-day option uses an equal-weight average of the same group’s 5-day and 20-day INDEX readings, as explained further below.
FEATURES
To use the auto switch:
The numeric symbols act only as period selectors. Their prices are not used in the breadth calculations, which continue to use the relevant TradingView INDEX feeds.
Why use the HKEX tickers?
Beyond the period selection convenience, it is also helps remove duplications.
The breadth panel follows the dates and updates of the chart on which it runs. On a US chart, today’s live bar can repeat the previous day’s breadth readings until new readings become available.
The suggested HKEX symbols offer a convenient viewing layout: their trading session has already finished when the US market opens, so the chart does not add a new bar for the live US session. This avoids the extra repeated bar that can appear on a US chart.
THE 10-DAY ESTIMATE
The 5-, 20-, 50-, 100-, 150- and 200-day options use the corresponding breadth ticker readings.
The 10-day option is an estimate, calculated from the available 5-day and 20-day percentages:
Estimated 10-day breadth = (5-day breadth + 20-day breadth) / 2
This provides an intermediate participation reading, but it is not a count of stocks above their actual 10-day moving averages. Treat it as an approximate breadth measure.
USE CASES
SETTINGS
DATA AND TIMEFRAME
The indicator uses TradingView’s INDEX breadth feeds and requires a 1-day chart. Other timeframes display an explanatory error.
The indicator displays the latest daily readings available from the underlying breadth feeds. The host chart’s trading session also affects when the panel refreshes. Availability and update timing depend on the underlying feeds and chart updates. Missing readings are displayed as N/A.
CHART SETUP
Use this indicator on a 1-day chart. All eleven sectors and three index groups appear together in one separate pane.
For the clearest view, stretch the indicator pane vertically to use as much chart height as possible, or maximize the pane. The layout works best when the breadth panel occupies most of the chart area.
HOW IT WORKS
The indicator retrieves participation readings from TradingView’s INDEX symbols, which provide the percentage of stocks trading above the corresponding daily moving average. The script brings those readings together in one panel.
Each sector or index group occupies a separate horizontal row. Its bars show the percentage of constituent stocks that trade above the selected daily moving average, measured against a 50% center line.
With the default colors:
- Green bars: more than half the stocks are above their moving average.
- Red bars: fewer than half are above their moving average.
- Longer bars: participation is further from 50%.
- Labels on the right: show each group’s latest displayed percentage.
At exactly 50%, the bar has no height.
The colors and bar heights represent participation — follow the changing bar heights to see whether participation is expanding or contracting. Changes in participation can support an assessment of rotation, particularly when considered alongside price trends and relative strength.
The eleven sector rows help reveal where strength and weakness are concentrated. The S&P 500, Value and Growth rows provide broader context for those differences.
The 10-day option uses an equal-weight average of the same group’s 5-day and 20-day INDEX readings, as explained further below.
FEATURES
- Eleven sectors in one panel: Communication Services, Consumer Discretionary, Consumer Staples, Energy, Financials, Health Care, Industrials, Materials, Technology, Real Estate and Utilities.
- Three broader comparisons: S&P 500 Core, S&P 500 Value and S&P 500 Growth.
- Seven lookback choices: 5, 10, 20, 50, 100, 150 and 200 days.
- Auto switch period: change the lookback directly from your watchlist, without reopening the indicator’s settings.
- Historical participation: compare current readings with earlier periods of strength, weakness and transition.
- Customizable colors: adjust positive and negative bars, text and center lines.
- Daily-chart layout: designed exclusively for the 1-day timeframe.
To use the auto switch:
- Create a watchlist with the ticker names 5, 10, 20, 50, 100, 150, and 200 (tickers HKEX:5, HKEX:10, HKEX:20, HKEX:50, HKEX:100, HKEX:150, and HKEX:200).
- Enable Auto switch period.
- Click through those watchlist entries. Selecting ticker 5 displays 5-day breadth, 20 displays 20-day breadth, and so on. Ticker 10 selects the estimated 10-day reading.
The numeric symbols act only as period selectors. Their prices are not used in the breadth calculations, which continue to use the relevant TradingView INDEX feeds.
Why use the HKEX tickers?
Beyond the period selection convenience, it is also helps remove duplications.
The breadth panel follows the dates and updates of the chart on which it runs. On a US chart, today’s live bar can repeat the previous day’s breadth readings until new readings become available.
The suggested HKEX symbols offer a convenient viewing layout: their trading session has already finished when the US market opens, so the chart does not add a new bar for the live US session. This avoids the extra repeated bar that can appear on a US chart.
THE 10-DAY ESTIMATE
The 5-, 20-, 50-, 100-, 150- and 200-day options use the corresponding breadth ticker readings.
The 10-day option is an estimate, calculated from the available 5-day and 20-day percentages:
Estimated 10-day breadth = (5-day breadth + 20-day breadth) / 2
This provides an intermediate participation reading, but it is not a count of stocks above their actual 10-day moving averages. Treat it as an approximate breadth measure.
USE CASES
- Watch for changes in leadership. Look for sectors recovering towards or above 50% while previously stronger sectors lose participation.
- Check how broadly strength is shared. If several sectors develop larger green bars together, participation is broadening. If only a few remain strong while others weaken, strength is becoming more concentrated.
- Compare shorter- and longer-term conditions. Shorter lookbacks highlight faster changes in participation. Longer lookbacks provide a view of more persistent strength or weakness.
- Compare Value and Growth. Observe whether participation is strengthening in both groups or diverging between them.
SETTINGS
- Moving Average period: selects the daily lookback. The default is 20 days. The 10-day option uses the estimate described above.
- Auto switch period: an optional watchlist shortcut. When checked, and the chart ticker’s name is 5, 10, 20, 50, 100, 150, or 200, that number selects the period. Any other ticker names use the manually selected Moving Average period. Disabled by default.
- Above 50% bar color: color for participation above the center line.
- Below 50% bar color: color for participation below the center line.
- Text color: applies to all sector labels, index labels and the panel title.
- 50% baseline color: adjusts the horizontal center lines.
DATA AND TIMEFRAME
The indicator uses TradingView’s INDEX breadth feeds and requires a 1-day chart. Other timeframes display an explanatory error.
The indicator displays the latest daily readings available from the underlying breadth feeds. The host chart’s trading session also affects when the panel refreshes. Availability and update timing depend on the underlying feeds and chart updates. Missing readings are displayed as N/A.

Haftungsausschluss
Die Informationen und Veröffentlichungen sind nicht als Finanz-, Anlage-, Handels- oder andere Arten von Ratschlägen oder Empfehlungen gedacht, die von TradingView bereitgestellt oder gebilligt werden, und stellen diese nicht dar. Lesen Sie mehr in den Nutzungsbedingungen.
Haftungsausschluss
Die Informationen und Veröffentlichungen sind nicht als Finanz-, Anlage-, Handels- oder andere Arten von Ratschlägen oder Empfehlungen gedacht, die von TradingView bereitgestellt oder gebilligt werden, und stellen diese nicht dar. Lesen Sie mehr in den Nutzungsbedingungen.