OPEN-SOURCE SCRIPT
MEXC Squeeze+EW Signal Engine PRO [3Commas]
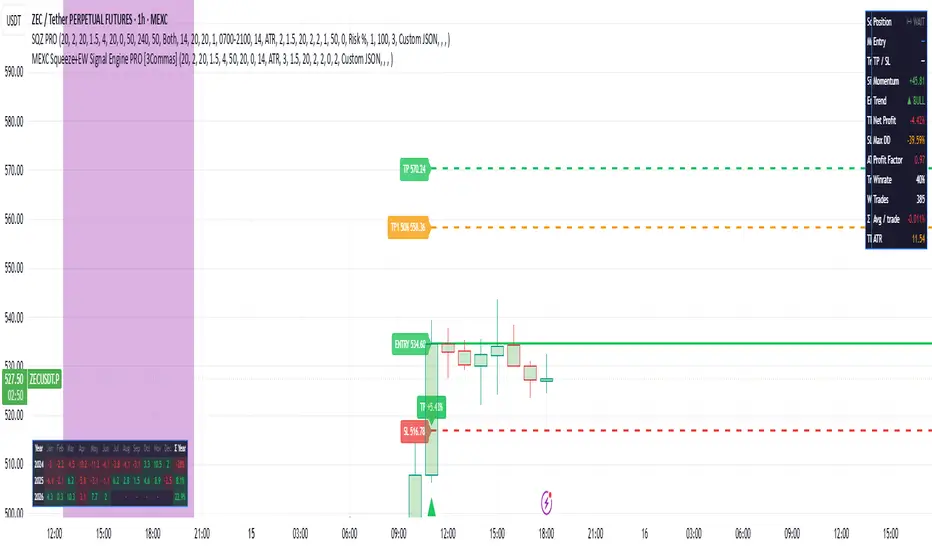
📊 SQZ PRO — Advanced Signal & Dashboard Indicator
Overview
SQZ PRO is a comprehensive trading indicator that combines squeeze momentum analysis with automated signal generation and a built-in performance dashboard. Designed for both futures and spot markets, it provides precise entry/exit signals with dynamic support/resistance levels and position sizing recommendations.
🔍 How It Works
The indicator identifies consolidation phases (squeezes) and breakout opportunities using a multi-factor approach:
Squeeze Detection: Monitors Bollinger Bands within Keltner Channels to detect low-volatility compression zones
Momentum Confirmation: Uses momentum oscillators to confirm breakout direction
Signal Generation: Produces BUY/SELL signals at optimal entry points with confidence levels (XL, L, S, XS)
Dynamic S/R Levels: Automatically plots key support and resistance zones based on recent price structure
ATR-Based Sizing: Calculates position size recommendations using Average True Range for risk management
Dashboard Metrics
The built-in dashboard displays real-time performance analytics:
Metric Description
Net PnL Cumulative profit/loss from generated signals
Win Rate Percentage of profitable trades
Profit Factor Ratio of gross profit to gross loss
Max Drawdown Largest peak-to-trough decline
Total Trades Number of signals generated
️ Settings & Parameters
Parameter Default Description
Length 20 Lookback period for calculations
Mult BB 2.0 Bollinger Bands multiplier
Mult KC 1.5 Keltner Channel multiplier
ATR Length 14 ATR calculation period
Signal Threshold 50 Minimum signal strength (0-100)
Show Dashboard true Toggle performance dashboard
Show S/R Levels true Toggle support/resistance lines
💡 How to Use
For Long Positions:
Wait for a BUY signal with XL or L confidence
Enter near the signal candle close
Place stop-loss below the nearest support level
Take profit at the next resistance zone
For Short Positions:
Wait for a SELL signal with XL or L confidence
Enter near the signal candle close
Place stop-loss above the nearest resistance level
Take profit at the next support zone
Risk Management:
Use XS signals for conservative entries
Scale in with S signals on confirmation
Full position with L/XL signals on strong breakouts
Backtest Results (Sample)
Initial Capital: 10,000 USDT
Net Profit: +6,104.49 USDT (+61.04%)
Total Trades: 361
Win Rate: 45.71%
Profit Factor: 1.309
Max Drawdown: 14.06%
CAGR: 21.51%
️ Disclaimer
This indicator is for educational and informational purposes only. Past performance does not guarantee future results. Trading cryptocurrencies and other financial instruments carries significant risk. Always use proper risk management and never trade with funds you cannot afford to lose. Perform your own backtesting and due diligence before using any signals in live trading.
Version History
v1.0 — Initial release with core squeeze detection and signals
v1.1 — Added dynamic S/R levels and ATR position sizing
v1.2 — Integrated performance dashboard with real-time metrics
Overview
SQZ PRO is a comprehensive trading indicator that combines squeeze momentum analysis with automated signal generation and a built-in performance dashboard. Designed for both futures and spot markets, it provides precise entry/exit signals with dynamic support/resistance levels and position sizing recommendations.
🔍 How It Works
The indicator identifies consolidation phases (squeezes) and breakout opportunities using a multi-factor approach:
Squeeze Detection: Monitors Bollinger Bands within Keltner Channels to detect low-volatility compression zones
Momentum Confirmation: Uses momentum oscillators to confirm breakout direction
Signal Generation: Produces BUY/SELL signals at optimal entry points with confidence levels (XL, L, S, XS)
Dynamic S/R Levels: Automatically plots key support and resistance zones based on recent price structure
ATR-Based Sizing: Calculates position size recommendations using Average True Range for risk management
Dashboard Metrics
The built-in dashboard displays real-time performance analytics:
Metric Description
Net PnL Cumulative profit/loss from generated signals
Win Rate Percentage of profitable trades
Profit Factor Ratio of gross profit to gross loss
Max Drawdown Largest peak-to-trough decline
Total Trades Number of signals generated
️ Settings & Parameters
Parameter Default Description
Length 20 Lookback period for calculations
Mult BB 2.0 Bollinger Bands multiplier
Mult KC 1.5 Keltner Channel multiplier
ATR Length 14 ATR calculation period
Signal Threshold 50 Minimum signal strength (0-100)
Show Dashboard true Toggle performance dashboard
Show S/R Levels true Toggle support/resistance lines
💡 How to Use
For Long Positions:
Wait for a BUY signal with XL or L confidence
Enter near the signal candle close
Place stop-loss below the nearest support level
Take profit at the next resistance zone
For Short Positions:
Wait for a SELL signal with XL or L confidence
Enter near the signal candle close
Place stop-loss above the nearest resistance level
Take profit at the next support zone
Risk Management:
Use XS signals for conservative entries
Scale in with S signals on confirmation
Full position with L/XL signals on strong breakouts
Backtest Results (Sample)
Initial Capital: 10,000 USDT
Net Profit: +6,104.49 USDT (+61.04%)
Total Trades: 361
Win Rate: 45.71%
Profit Factor: 1.309
Max Drawdown: 14.06%
CAGR: 21.51%
️ Disclaimer
This indicator is for educational and informational purposes only. Past performance does not guarantee future results. Trading cryptocurrencies and other financial instruments carries significant risk. Always use proper risk management and never trade with funds you cannot afford to lose. Perform your own backtesting and due diligence before using any signals in live trading.
Version History
v1.0 — Initial release with core squeeze detection and signals
v1.1 — Added dynamic S/R levels and ATR position sizing
v1.2 — Integrated performance dashboard with real-time metrics
Open-source Skript
Ganz im Sinne von TradingView hat dieser Autor sein/ihr Script als Open-Source veröffentlicht. Auf diese Weise können nun auch andere Trader das Script rezensieren und die Funktionalität überprüfen. Vielen Dank an den Autor! Sie können das Script kostenlos verwenden, aber eine Wiederveröffentlichung des Codes unterliegt unseren Hausregeln.

Haftungsausschluss
Die Informationen und Veröffentlichungen sind nicht als Finanz-, Anlage-, Handels- oder andere Arten von Ratschlägen oder Empfehlungen gedacht, die von TradingView bereitgestellt oder gebilligt werden, und stellen diese nicht dar. Lesen Sie mehr in den Nutzungsbedingungen.
Open-source Skript
Ganz im Sinne von TradingView hat dieser Autor sein/ihr Script als Open-Source veröffentlicht. Auf diese Weise können nun auch andere Trader das Script rezensieren und die Funktionalität überprüfen. Vielen Dank an den Autor! Sie können das Script kostenlos verwenden, aber eine Wiederveröffentlichung des Codes unterliegt unseren Hausregeln.
Haftungsausschluss
Die Informationen und Veröffentlichungen sind nicht als Finanz-, Anlage-, Handels- oder andere Arten von Ratschlägen oder Empfehlungen gedacht, die von TradingView bereitgestellt oder gebilligt werden, und stellen diese nicht dar. Lesen Sie mehr in den Nutzungsbedingungen.